Food Lion 2014 Annual Report Download - page 114
Download and view the complete annual report
Please find page 114 of the 2014 Food Lion annual report below. You can navigate through the pages in the report by either clicking on the pages listed below, or by using the keyword search tool below to find specific information within the annual report.-
 1
1 -
2
-
3
-
4
-
5
-
6
-
7
-
8
-
9
-
10
-
11
-
12
-
13
-
14
-
15
-
16
-
17
-
18
-
19
-
20
-
21
-
22
-
23
-
24
-
25
-
26
-
27
-
28
-
29
-
30
-
31
-
32
-
33
-
34
-
35
-
36
-
37
-
38
-
39
-
40
-
41
-
42
-
43
-
44
-
45
-
46
-
47
-
48
-
49
-
50
-
51
-
52
-
53
-
54
-
55
-
56
-
57
-
58
-
59
-
60
-
61
-
62
-
63
-
64
-
65
-
66
-
67
-
68
-
69
-
70
-
71
-
72
-
73
-
74
-
75
-
76
-
77
-
78
-
79
-
80
-
81
-
82
-
83
-
84
-
85
-
86
-
87
-
88
-
89
-
90
-
91
-
92
-
93
-
94
-
95
-
96
-
97
-
98
-
99
-
100
-
101
-
102
-
103
-
 104
104 -
 105
105 -
 106
106 -
 107
107 -
 108
108 -
 109
109 -
 110
110 -
 111
111 -
 112
112 -
 113
113 -
 114
114 -
 115
115 -
 116
116 -
 117
117 -
 118
118 -
 119
119 -
 120
120 -
 121
121 -
 122
122 -
 123
123 -
 124
124 -
125
-
126
-
127
-
128
-
129
-
130
-
131
-
132
-
133
-
134
-
135
-
136
-
137
-
138
-
139
-
140
-
141
-
142
-
143
-
144
-
145
-
146
-
147
-
148
-
149
-
150
-
151
-
152
-
153
-
154
-
155
-
156
-
157
-
158
-
159
-
160
-
161
-
162
-
163
-
164
-
165
-
166
-
167
-
168
-
169
-
170
-
171
-
172
 |
 |
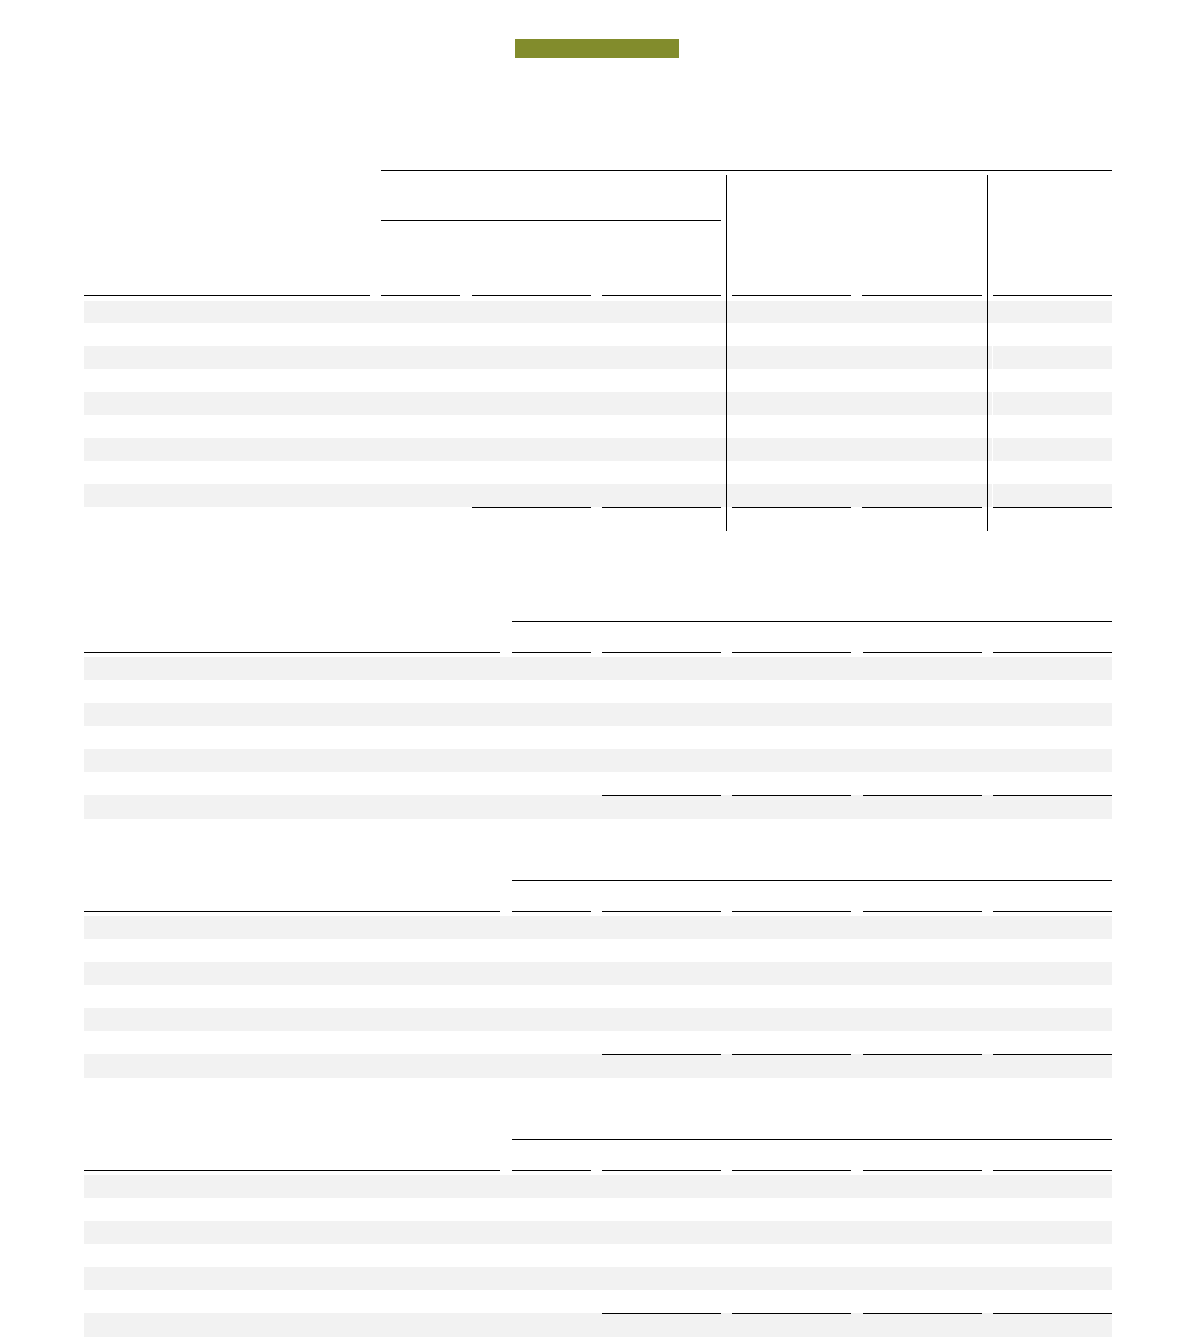
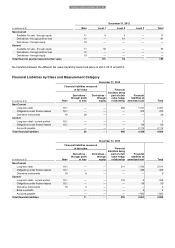
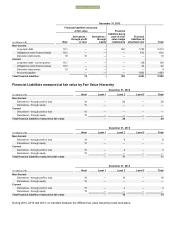
110 // DELHAIZE GROUP FINANCIAL STATEMENTS 2014
December 31, 2012
Financial liabilities measured
at fair value
Financial
(in millions of €)
Note
Derivatives
-
through profit
or loss
Derivatives
-
through
equity
liabilities being
part of a fair
value hedge
relationship
Financial
liabilities at
amortized cost
Total
Non-Current
Long-term debt
18.1
—
—
561
1 752
2 313
Obligations under finance leases
18.3
—
—
—
612
612
Derivative instruments
19
10
—
—
—
10
Current
Long-term debt - current portion
18.1
—
—
—
156
156
Obligations under finance leases
18.3
—
—
—
62
62
Derivative instruments
19
4
—
—
—
4
Accounts payable
—
—
—
1 869
1 869
Total financial liabilities
14
—
561
4 451
5 026
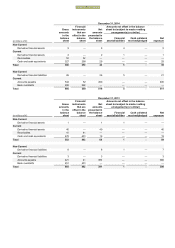
Financial Liabilities measured at fair value by Fair Value Hierarchy
December 31, 2014
(in millions of €)
Note
Level 1
Level 2
Level 3
Total
Non-Current
Derivatives - through profit or loss
19
—
26
—
26
Derivatives - through equity
19
—
—
—
—
Current
Derivatives - through profit or loss
19
—
—
—
—
Derivatives - through equity
19
—
—
—
—
Total financial liabilities measured at fair value
—
26
—
26
December 31, 2013
(in millions of €)
Note
Level 1
Level 2
Level 3
Total
Non-Current
Derivatives - through profit or loss
19
—
8
—
8
Derivatives - through equity
19
—
—
—
—
Current
Derivatives - through profit or loss
19
—
3
—
3
Derivatives - through equity
19
—
—
—
—
Total financial liabilities measured at fair value
—
11
—
11
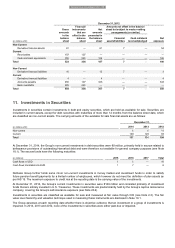
December 31, 2012
(in millions of €)
Note
Level 1
Level 2
Level 3
Total
Non-Current
Derivatives - through profit or loss
19
—
10
—
10
Derivatives - through equity
19
—
—
—
—
Current
Derivatives - through profit or loss
19
—
4
—
4
Derivatives - through equity
19
—
—
—
—
Total financial liabilities measured at fair value
—
14
—
14
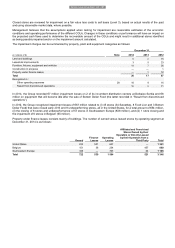
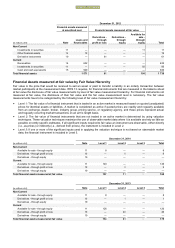
During 2014, 2013 and 2012, no transfers between the different fair value hierarchy levels took place.
FINANCIAL STATEMENTS