Food Lion 2014 Annual Report Download - page 137
Download and view the complete annual report
Please find page 137 of the 2014 Food Lion annual report below. You can navigate through the pages in the report by either clicking on the pages listed below, or by using the keyword search tool below to find specific information within the annual report.-
 1
1 -
2
-
3
-
4
-
5
-
6
-
7
-
8
-
9
-
10
-
11
-
12
-
13
-
14
-
15
-
16
-
17
-
18
-
19
-
20
-
21
-
22
-
23
-
24
-
25
-
26
-
27
-
28
-
29
-
30
-
31
-
32
-
33
-
34
-
35
-
36
-
37
-
38
-
39
-
40
-
41
-
42
-
43
-
44
-
45
-
46
-
47
-
48
-
49
-
50
-
51
-
52
-
53
-
54
-
55
-
56
-
57
-
58
-
59
-
60
-
61
-
62
-
63
-
64
-
65
-
66
-
67
-
68
-
69
-
70
-
71
-
72
-
73
-
74
-
75
-
76
-
77
-
78
-
79
-
80
-
81
-
82
-
83
-
84
-
85
-
86
-
87
-
88
-
89
-
90
-
91
-
92
-
93
-
94
-
95
-
96
-
97
-
98
-
99
-
100
-
101
-
102
-
103
-
104
-
105
-
106
-
107
-
108
-
109
-
110
-
111
-
112
-
113
-
114
-
115
-
116
-
117
-
118
-
119
-
120
-
121
-
122
-
123
-
124
-
125
-
126
-
 127
127 -
 128
128 -
 129
129 -
 130
130 -
 131
131 -
 132
132 -
 133
133 -
 134
134 -
 135
135 -
 136
136 -
 137
137 -
 138
138 -
 139
139 -
 140
140 -
 141
141 -
 142
142 -
 143
143 -
 144
144 -
 145
145 -
 146
146 -
 147
147 -
148
-
149
-
150
-
151
-
152
-
153
-
154
-
155
-
156
-
157
-
158
-
159
-
160
-
161
-
162
-
163
-
164
-
165
-
166
-
167
-
168
-
169
-
170
-
171
-
172
 |
 |

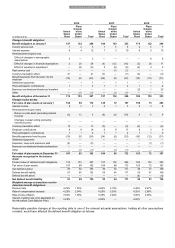
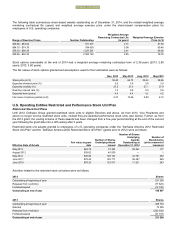
DELHAIZE GROUP FINANCIAL STATEMENTS 2014 // 133
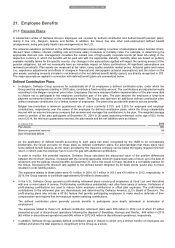
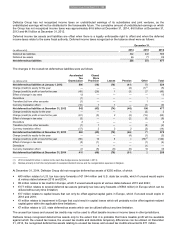
2014
2013
2012
(in millions of €)
United
States
Plans
Plans
Outside
of the
United
States
Total
United
States
Plans
Plans
Outside
of the
United
States
Total
United
States
Plans
Plans
Outside
of the
United
States
Total
Change in benefit obligation:
Benefit obligation at January 1
157
132
289
180
153
333
174
122
296
Current service cost
1
4
5
1
5
6
2
5
7
Interest expense
8
4
12
7
3
10
8
5
13
Remeasurement (gain) loss
Effect of changes in demographic
assumptions
3
—
3
—
—
—
—
6
6
Effect of changes in financial assumptions
2
26
28
(4)
(12)
(16)
(3)
20
17
Effect of experience adjustment
—
(9)
(9)
3
(8)
(5)
(2)
4
2
Past service cost
—
—
—
—
(1)
(1)
—
—
—
Currency translation effect
21
—
21
(7)
—
(7)
(3)
—
(3)
Benefit payments from the plan / by the
employer
(19)
(5)
(24)
(24)
(9)
(33)
(19)
(12)
(31)
Settlement payments
—
1
1
—
1
1
—
1
1
Plan participants’ contributions
1
1
2
1
1
2
1
1
2
Business combinations/divestures/ transfers
—
—
—
—
—
—
22
1
23
Other
—
(1)
(1)
—
(1)
(1)
—
—
—
Benefit obligation at December 31
174
153
327
157
132
289
180
153
333
Change in plan assets:
Fair value of plan assets at January 1
104
68
172
125
72
197
130
73
203
Interest income
5
2
7
4
1
5
5
3
8
Remeasurement gain (loss)
Return on plan asset (excluding interest
income)
(3)
12
9
(6)
(4)
(10)
4
5
9
Changes in asset ceiling (excluding
interest income)
—
—
—
—
—
—
—
—
—
Curren
cy translation effect
13
—
13
(5)
—
(5)
(2)
—
(2)
Employer contributions
8
8
16
9
8
17
6
3
9
Plan participants’ contributions
1
1
2
1
1
2
1
1
2
Benefits payments from the plan
(19)
(5)
(24)
(24)
(9)
(33)
(19)
(12)
(31)
Settlement payments
—
—
—
—
—
—
—
—
—
Expenses, taxes and premiums paid
(2)
—
(2)
—
—
—
—
(1)
(1)
Business combinations/divestures/transfers
—
—
—
—
—
—
—
—
—
Other
—
(1)
(1)
—
(1)
(1)
—
—
—
Fair value of plan assets at December 31
107
85
192
104
68
172
125
72
197
Amounts recognized in the balance
sheet:
Present value of defined benefit obligations
174
153
327
157
132
289
180
153
333
Fair value of plan assets
107
85
192
104
68
172
125
72
197
Net deficit/(surplus)
67
68
135
53
64
117
55
81
136
Defined benefit liability
67
68
135
53
64
117
59
81
140
Defined benefit asset
—
—
—
—
—
—
(4)
—
(4)
Net defined benefit liability
67
68
135
53
64
117
55
81
136
Weighted average assumptions used to
determine benefit obligations:
Discount rate
4.25%
1.55%
4.85%
3.19%
3.49%
2.27%
Rate of compensation increase
4.25%
2.94%
4.25%
3.03%
4.25%
2.66%
Rate of price inflation
3.50%
1.98%
3.48%
2.02%
3.05%
2.00%
Interest crediting rate (only applicable for
the Hannaford Cash Balance Plan)
3.25%
—
4.00%
—
4.00%
—
Reasonably possible changes at the reporting date to one of the relevant actuarial assumptions, holding all other assumptions
constant, would have affected the defined benefit obligation as follows:
Delhaize Group Annual Report 2014 • 135