Food Lion 2014 Annual Report Download - page 128
Download and view the complete annual report
Please find page 128 of the 2014 Food Lion annual report below. You can navigate through the pages in the report by either clicking on the pages listed below, or by using the keyword search tool below to find specific information within the annual report.-
 1
1 -
2
-
3
-
4
-
5
-
6
-
7
-
8
-
9
-
10
-
11
-
12
-
13
-
14
-
15
-
16
-
17
-
18
-
19
-
20
-
21
-
22
-
23
-
24
-
25
-
26
-
27
-
28
-
29
-
30
-
31
-
32
-
33
-
34
-
35
-
36
-
37
-
38
-
39
-
40
-
41
-
42
-
43
-
44
-
45
-
46
-
47
-
48
-
49
-
50
-
51
-
52
-
53
-
54
-
55
-
56
-
57
-
58
-
59
-
60
-
61
-
62
-
63
-
64
-
65
-
66
-
67
-
68
-
69
-
70
-
71
-
72
-
73
-
74
-
75
-
76
-
77
-
78
-
79
-
80
-
81
-
82
-
83
-
84
-
85
-
86
-
87
-
88
-
89
-
90
-
91
-
92
-
93
-
94
-
95
-
96
-
97
-
98
-
99
-
100
-
101
-
102
-
103
-
104
-
105
-
106
-
107
-
108
-
109
-
110
-
111
-
112
-
113
-
114
-
115
-
116
-
117
-
 118
118 -
 119
119 -
 120
120 -
 121
121 -
 122
122 -
 123
123 -
 124
124 -
 125
125 -
 126
126 -
 127
127 -
 128
128 -
 129
129 -
 130
130 -
 131
131 -
 132
132 -
 133
133 -
 134
134 -
 135
135 -
 136
136 -
 137
137 -
 138
138 -
139
-
140
-
141
-
142
-
143
-
144
-
145
-
146
-
147
-
148
-
149
-
150
-
151
-
152
-
153
-
154
-
155
-
156
-
157
-
158
-
159
-
160
-
161
-
162
-
163
-
164
-
165
-
166
-
167
-
168
-
169
-
170
-
171
-
172
 |
 |

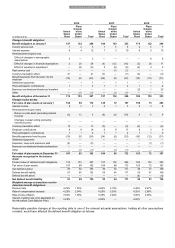
124 // DELHAIZE GROUP FINANCIAL STATEMENTS 2014
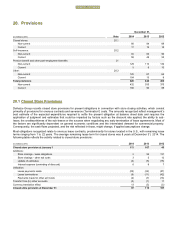
(in millions of €)
2015
2016
2017
2018
2019
Thereafter
Total
Future minimum lease payments to be received
32
23
12
5
3
14
89
Of which related to sub-lease agreements
18
13
6
1
1
3
42
The total amount of €89 million represents expected future lease income to be recognized as such in the income statement and
excludes expected future sub-lease payments to receive in relation to stores being part of the “Closed store provision” (see Note
20.1).
Contracts including contingent rent clauses are insignificant to the Group.
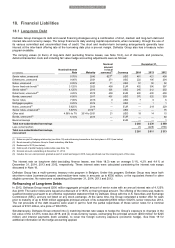
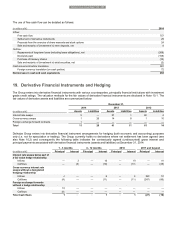
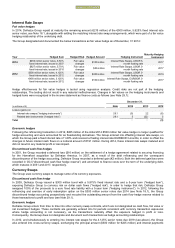
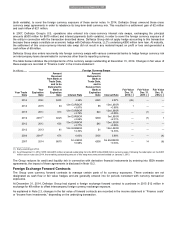
18.4 Net Debt
The Group defines net debt as non-current financial liabilities, plus current financial liabilities and derivative financial liabilities,
minus derivative financial assets, investments in securities and term deposits, and cash and cash equivalents:
December 31,
(in millions of €)
Note
2014
2013
2012
Non-current financial liabilities
18.1, 18.3
2 676
2 507
2 925
Current financial liabilities
18.1, 18.2, 18.3
70
291
218
Derivative liabilities
10.2, 19
26
11
14
Derivative assets
10.2, 19
(11)
(41)
(61)
Investments in securities - non current
11
(8)
(8)
(11)
Investments in securities - current
11
(149)
(126)
(93)
Term deposits
- current
12
(7)
(12)
—
Cash and cash equivalents
15
(1 600)
(1 149)
(920)
Net debt
997
1 473
2 072
Net debt to equity ratio
18.3%
29.0%
40.0%
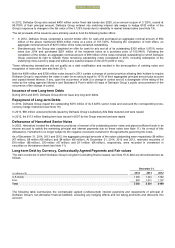
The following table summarizes the movement of net debt during 2014:
(in millions of €)
Net debt at January 1, 2014
1 473
Free cash flow
(757)
Adjustment for net cash received from derivative instruments (included in free cash flow)
30
Exercise of stock options and warrants
(24)
Purchase of treasury shares
10
Dividends paid
158
Net debt after cash movements
890
Currency translation effect on assets and liabilities
4
Amounts classified as held for sale
(47)
Other non-cash movements
21
Foreign currency impact
129
Net debt at December 31, 2014
997
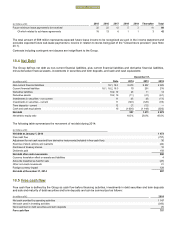
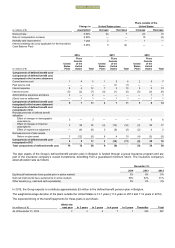
18.5 Free cash flow
Free cash flow is defined by the Group as cash flow before financing activities, investments in debt securities and term deposits
and sale and maturity of debt securities and term deposits and can be summarized as follows:
(in millions of €)
2014
Net cash provided by operating activities
1 147
Net cash used in investing activities
(383)
Net investment in debt securities and term deposits
(7)
Free cash flow
757
FINANCIAL STATEMENTS