Food Lion 2014 Annual Report Download - page 106
Download and view the complete annual report
Please find page 106 of the 2014 Food Lion annual report below. You can navigate through the pages in the report by either clicking on the pages listed below, or by using the keyword search tool below to find specific information within the annual report.-
 1
1 -
2
-
3
-
4
-
5
-
6
-
7
-
8
-
9
-
10
-
11
-
12
-
13
-
14
-
15
-
16
-
17
-
18
-
19
-
20
-
21
-
22
-
23
-
24
-
25
-
26
-
27
-
28
-
29
-
30
-
31
-
32
-
33
-
34
-
35
-
36
-
37
-
38
-
39
-
40
-
41
-
42
-
43
-
44
-
45
-
46
-
47
-
48
-
49
-
50
-
51
-
52
-
53
-
54
-
55
-
56
-
57
-
58
-
59
-
60
-
61
-
62
-
63
-
64
-
65
-
66
-
67
-
68
-
69
-
70
-
71
-
72
-
73
-
74
-
75
-
76
-
77
-
78
-
79
-
80
-
81
-
82
-
83
-
84
-
85
-
86
-
87
-
88
-
89
-
90
-
91
-
92
-
93
-
94
-
95
-
 96
96 -
 97
97 -
 98
98 -
 99
99 -
 100
100 -
 101
101 -
 102
102 -
 103
103 -
 104
104 -
 105
105 -
 106
106 -
 107
107 -
 108
108 -
 109
109 -
 110
110 -
 111
111 -
 112
112 -
 113
113 -
 114
114 -
 115
115 -
 116
116 -
117
-
118
-
119
-
120
-
121
-
122
-
123
-
124
-
125
-
126
-
127
-
128
-
129
-
130
-
131
-
132
-
133
-
134
-
135
-
136
-
137
-
138
-
139
-
140
-
141
-
142
-
143
-
144
-
145
-
146
-
147
-
148
-
149
-
150
-
151
-
152
-
153
-
154
-
155
-
156
-
157
-
158
-
159
-
160
-
161
-
162
-
163
-
164
-
165
-
166
-
167
-
168
-
169
-
170
-
171
-
172
 |
 |

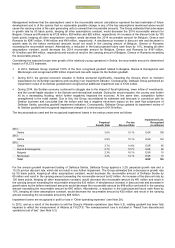
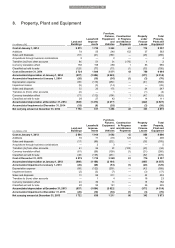
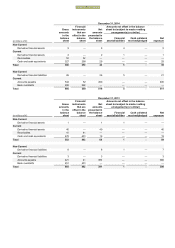
102 // DELHAIZE GROUP FINANCIAL STATEMENTS 2014
(in millions of €)
Trade
Names
Developed
Software
Purchased
Software
Favorable
Lease
Rights
Other
Total
Cost at January 1, 2013
575
271
321
154
63
1 384
Additions
—
36
32
—
11
79
Sales and disposals
—
(1)
(2)
(16)
(3)
(22)
Transfers (to) from other accounts
—
(12)
21
—
(8)
1
Classified as held for sale
(38)
—
(1)
(10)
(6)
(55)
Currency translation effect
(18)
(4)
(12)
(6)
(2)
(42)
Cost at December 31, 2013
519
290
359
122
55
1 345
Accumulated amortization at January 1, 2013
—
(142)
(211)
(102)
(28)
(483)
Accumulated impairment at January 1, 2013
(51)
—
—
—
(2)
(53)
Amortization expense
—
(33)
(41)
(9)
(4)
(87)
Impairment losses
(71)
—
—
—
(1)
(72)
Sales and disposals
—
—
2
15
1
18
Transfers to (from) other accounts
—
—
(1)
(1)
2
—
Classified as held for sale
34
—
1
7
3
45
Currency translation effect
3
4
8
4
—
19
Accumulated amortization at December 31, 2013
—
(171)
(242)
(86)
(27)
(526)
Accumulated impairment at December 31, 2013
(85)
—
—
—
(2)
(87)
Net carrying amount at December 31, 2013
434
119
117
36
26
732
(in millions of €)
Trade
Names
Developed
Software
Purchased
Software
Favorable
Lease
Rights
Other
Total
Cost at January 1, 2012
599
222
281
170
65
1 337
Additions
—
71
17
—
4
92
Sales and disposals
—
—
(2)
(12)
(4)
(18)
Transfers (to) from other accounts
—
(20)
30
—
—
10
Classified as held for sale
(3)
—
—
—
—
(3)
Currency translation effect
(21)
(2)
(5)
(4)
(2)
(34)
Cost at December 31, 2012
575
271
321
154
63
1 384
Accumulated amortization at January 1, 2012
—
(116)
(171)
(105)
(30)
(422)
Accumulated impairment at January 1, 2012
(36)
—
—
—
(1)
(37)
Amortization expense
—
(27)
(36)
(11)
(3)
(77)
Impairment losses
(15)
—
—
—
(2)
(17)
Sales and disposals
—
—
1
12
4
17
Transfers to (from) other accounts
—
—
(8)
—
—
(8)
Currency translation effect
—
1
3
2
2
8
Accumulated amortization at December 31, 2012
—
(142)
(211)
(102)
(28)
(483)
Accumulated impairment at December 31, 2012
(51)
—
—
—
(2)
(53)
Net carrying amount at December 31, 2012
524
129
110
52
33
848
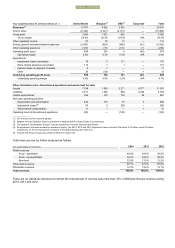
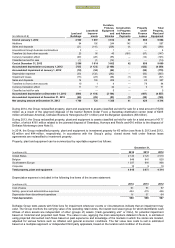
Trade name assets are allocated to the following cash generating units:
December 31,
(in millions of €)
2014
2013
2012
Food Lion
208
184
196
Hannaford
178
156
163
Delhaize America
386
340
359
Serbia
70
84
151
Bulgaria
—
10
14
Southeastern Europe
70
94
165
Total
456
434
524
Amortization expenses are mainly charged to selling, general and administrative expenses.
FINANCIAL STATEMENTS