Food Lion 2014 Annual Report Download - page 103
Download and view the complete annual report
Please find page 103 of the 2014 Food Lion annual report below. You can navigate through the pages in the report by either clicking on the pages listed below, or by using the keyword search tool below to find specific information within the annual report.-
 1
1 -
2
-
3
-
4
-
5
-
6
-
7
-
8
-
9
-
10
-
11
-
12
-
13
-
14
-
15
-
16
-
17
-
18
-
19
-
20
-
21
-
22
-
23
-
24
-
25
-
26
-
27
-
28
-
29
-
30
-
31
-
32
-
33
-
34
-
35
-
36
-
37
-
38
-
39
-
40
-
41
-
42
-
43
-
44
-
45
-
46
-
47
-
48
-
49
-
50
-
51
-
52
-
53
-
54
-
55
-
56
-
57
-
58
-
59
-
60
-
61
-
62
-
63
-
64
-
65
-
66
-
67
-
68
-
69
-
70
-
71
-
72
-
73
-
74
-
75
-
76
-
77
-
78
-
79
-
80
-
81
-
82
-
83
-
84
-
85
-
86
-
87
-
88
-
89
-
90
-
91
-
92
-
 93
93 -
 94
94 -
 95
95 -
 96
96 -
 97
97 -
 98
98 -
 99
99 -
 100
100 -
 101
101 -
 102
102 -
 103
103 -
 104
104 -
 105
105 -
 106
106 -
 107
107 -
 108
108 -
 109
109 -
 110
110 -
 111
111 -
 112
112 -
 113
113 -
114
-
115
-
116
-
117
-
118
-
119
-
120
-
121
-
122
-
123
-
124
-
125
-
126
-
127
-
128
-
129
-
130
-
131
-
132
-
133
-
134
-
135
-
136
-
137
-
138
-
139
-
140
-
141
-
142
-
143
-
144
-
145
-
146
-
147
-
148
-
149
-
150
-
151
-
152
-
153
-
154
-
155
-
156
-
157
-
158
-
159
-
160
-
161
-
162
-
163
-
164
-
165
-
166
-
167
-
168
-
169
-
170
-
171
-
172
 |
 |

DELHAIZE GROUP FINANCIAL STATEMENTS 2014 // 99
The FVLCTS is based on discounted cash flow calculations, in local currencies, using cash flow projections based on the
latest available financial plans approved by management for all CGUs, as explained above. Cash flows beyond the three-
year period are extrapolated to ten years in line with market participant assumptions. Beyond ten years, perpetual growth
rates do not exceed the long-term average growth rate for the supermarket retail business in the particular market in
question and the long-term economic growth of the respective country. Operating margins are kept in line with longer term
market participant assumptions. Delhaize Group uses pre-tax cash flows which are discounted applying a pre-tax rate, being
derived from the CGU’s WACC as described above. The FVLCTS represents a Level 3 fair value in the IFRS 13 fair value
hierarchy. Earnings multiples paid for similar companies in the market are used to ensure appropriateness of the FVLCTS
estimates and overall consistency.
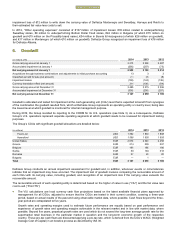
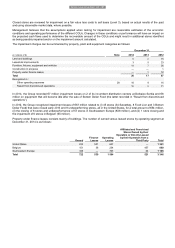
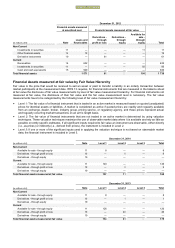
United States
The recoverable amount of Hannaford is determined based on VIU. In 2014, the recoverable amount of Food Lion was
determined based on FVLCTS and VIU estimates. The FVLCTS estimate takes into account the new strategy centered around
Easy, Fresh and Affordable, which the Group started to test in 2013, while the VIU estimate does not consider any cash flows
related to this strategy. With the fair value being above the VIU, the fair value represents the recoverable amount, with both
values being significantly above the carrying amount. The key assumptions used for the recoverable amount calculations were
as follows:
Perpetual
Growth Rate
Pre-
tax Discount
rate
2014:
Food Lion (FVLCTS)
2.1%
10.4%
Hannaford (VIU)
2.1%
10.5%
2013:
Food Lion (FVLCTS)
2.1%
10.4%
Hannaford (VIU)
2.1%
10.6%
2012:
Food Lion (VIU)
2.3%
10.1%
Hannaford (VIU)
2.3%
9.6%
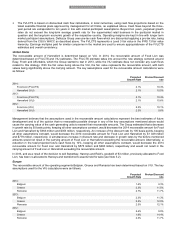
Management believes that the assumptions used in the recoverable amount calculations represent the best estimates of future
development and is of the opinion that no reasonable possible change in any of the key assumptions mentioned above would
cause the carrying value of the cash generating units to exceed their recoverable amounts. The Group estimated that a decrease
in growth rate by 50 basis points, keeping all other assumptions constant, would decrease the 2014 recoverable amount for Food
Lion and Hannaford by $363 million and $353 million, respectively. An increase of the discount rate by 100 basis points, keeping
all other assumptions constant, would decrease the 2014 recoverable amount for Food Lion and Hannaford by $1 029 million
and $779 million, respectively. A simultaneous increase in discount rate and decrease in growth rates by the before mentioned
amounts would not result in the carrying amount of Food Lion or Hannaford exceeding the recoverable amount. Alternatively, a
reduction in the total projected future cash flows by 10%, keeping all other assumptions constant, would decrease the 2014
recoverable amount for Food Lion and Hannaford by $576 million and $460 million, respectively and would not result in the
carrying amount of Food Lion or Hannaford exceeding the recoverable amount.
In 2013, and as a result of the decision to sell Sweetbay, Harveys and Reid’s, goodwill of €3 million, previously allocated to Food
Lion, has been re-allocated to Harveys and transferred to assets held for sale (see Note 5.2).
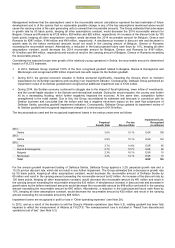
Europe
The recoverable amount of the operating segments Belgium, Greece and Romania has been determined based on VIU. The key
assumptions used for the VIU calculations were as follows:
Perpetual
Growth Rate
Pre-
tax Discount
rate
2014:
Belgium
1.4%
9.3%
Greece
2.3%
11.5%
Romania
2.7%
11.7%
2013:
Belgium
2.3%
11.3%
Greece
2.3%
12.9%
Romania
2.5%
12.1%
2012:
Belgium
2.4%
9.9%
Greece
1.6%
14.4%
Romania
2.3%
11.7%
Delhaize Group Annual Report 2014 • 101