Food Lion 2014 Annual Report Download - page 75
Download and view the complete annual report
Please find page 75 of the 2014 Food Lion annual report below. You can navigate through the pages in the report by either clicking on the pages listed below, or by using the keyword search tool below to find specific information within the annual report.-
 1
1 -
2
-
3
-
4
-
5
-
6
-
7
-
8
-
9
-
10
-
11
-
12
-
13
-
14
-
15
-
16
-
17
-
18
-
19
-
20
-
21
-
22
-
23
-
24
-
25
-
26
-
27
-
28
-
29
-
30
-
31
-
32
-
33
-
34
-
35
-
36
-
37
-
38
-
39
-
40
-
41
-
42
-
43
-
44
-
45
-
46
-
47
-
48
-
49
-
50
-
51
-
52
-
53
-
54
-
55
-
56
-
57
-
58
-
59
-
60
-
61
-
62
-
63
-
64
-
 65
65 -
 66
66 -
 67
67 -
 68
68 -
 69
69 -
 70
70 -
 71
71 -
 72
72 -
 73
73 -
 74
74 -
 75
75 -
 76
76 -
 77
77 -
 78
78 -
 79
79 -
 80
80 -
 81
81 -
 82
82 -
 83
83 -
 84
84 -
 85
85 -
86
-
87
-
88
-
89
-
90
-
91
-
92
-
93
-
94
-
95
-
96
-
97
-
98
-
99
-
100
-
101
-
102
-
103
-
104
-
105
-
106
-
107
-
108
-
109
-
110
-
111
-
112
-
113
-
114
-
115
-
116
-
117
-
118
-
119
-
120
-
121
-
122
-
123
-
124
-
125
-
126
-
127
-
128
-
129
-
130
-
131
-
132
-
133
-
134
-
135
-
136
-
137
-
138
-
139
-
140
-
141
-
142
-
143
-
144
-
145
-
146
-
147
-
148
-
149
-
150
-
151
-
152
-
153
-
154
-
155
-
156
-
157
-
158
-
159
-
160
-
161
-
162
-
163
-
164
-
165
-
166
-
167
-
168
-
169
-
170
-
171
-
172
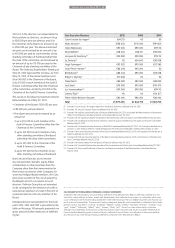
 |
 |

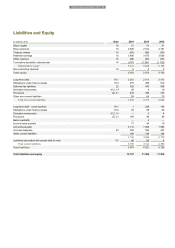
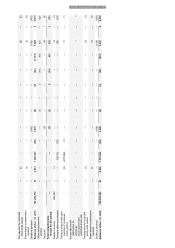
DELHAIZE GROUP FINANCIAL STATEMENTS 2014 // 71
Liabilities and Equity
(in millions of €)
Note
2014
2013
2012
Share capital
16
51
51
51
Share premium
16
2 838
2 814
2 791
Treasury shares
16
(63)
(66)
(59)
Retained earnings
16
3 606
3 675
3 638
Other reserves
16
(68)
(55)
(59)
Cumulative translation adjustments
16
(917)
(1 351)
(1 178)
Shareholders’ equity
5 447
5 068
5 184
Non-controlling interests
16
6
5
2
Total equity
5 453
5 073
5 186
Long-term debt
18.1
2 201
2 011
2 313
Obligations under finance leases
18.3
475
496
612
Deferred tax liabilities
22
302
443
566
Derivative instruments
10.2, 19
26
8
10
Provisions
20, 21
432
355
375
Other non-current liabilities
58
64
70
Total non-current liabilities
3 494
3 377
3 946
Long-term debt - current portion
18.1
1
228
156
Obligations under finance leases
18.3
69
59
62
Derivative instruments
10.2, 19
—
3
4
Provisions
20, 21
188
90
88
Bank overdrafts
—
4
—
Income taxes payable
77
44
19
Accounts payable
2 112
1 993
1 869
Accrued expenses
23
525
526
437
Other current liabilities
168
139
144
3 140
3 086
2 779
Liabilities associated with assets held for sale
5.2
40
58
4
Total current liabilities
3 180
3 144
2 783
Total liabilities
6 674
6 521
6 729
Total liabilities and equity
12 127
11 594
11 915
Delhaize Group Annual Report 2014 • 73