Food Lion 2014 Annual Report Download - page 30
Download and view the complete annual report
Please find page 30 of the 2014 Food Lion annual report below. You can navigate through the pages in the report by either clicking on the pages listed below, or by using the keyword search tool below to find specific information within the annual report.-
 1
1 -
2
-
3
-
4
-
5
-
6
-
7
-
8
-
9
-
10
-
11
-
12
-
13
-
14
-
15
-
16
-
17
-
18
-
19
-
 20
20 -
 21
21 -
 22
22 -
 23
23 -
 24
24 -
 25
25 -
 26
26 -
 27
27 -
 28
28 -
 29
29 -
 30
30 -
 31
31 -
 32
32 -
 33
33 -
 34
34 -
 35
35 -
 36
36 -
 37
37 -
 38
38 -
 39
39 -
 40
40 -
41
-
42
-
43
-
44
-
45
-
46
-
47
-
48
-
49
-
50
-
51
-
52
-
53
-
54
-
55
-
56
-
57
-
58
-
59
-
60
-
61
-
62
-
63
-
64
-
65
-
66
-
67
-
68
-
69
-
70
-
71
-
72
-
73
-
74
-
75
-
76
-
77
-
78
-
79
-
80
-
81
-
82
-
83
-
84
-
85
-
86
-
87
-
88
-
89
-
90
-
91
-
92
-
93
-
94
-
95
-
96
-
97
-
98
-
99
-
100
-
101
-
102
-
103
-
104
-
105
-
106
-
107
-
108
-
109
-
110
-
111
-
112
-
113
-
114
-
115
-
116
-
117
-
118
-
119
-
120
-
121
-
122
-
123
-
124
-
125
-
126
-
127
-
128
-
129
-
130
-
131
-
132
-
133
-
134
-
135
-
136
-
137
-
138
-
139
-
140
-
141
-
142
-
143
-
144
-
145
-
146
-
147
-
148
-
149
-
150
-
151
-
152
-
153
-
154
-
155
-
156
-
157
-
158
-
159
-
160
-
161
-
162
-
163
-
164
-
165
-
166
-
167
-
168
-
169
-
170
-
171
-
172
 |
 |

Delhaize Group shares trade on NYSE Euronext Brussels under the symbol DELB.
American Depositary Shares (ADS) are traded on the New York Stock Exchange under
the symbol DEG.
ADSs are evidenced by American Depositary Receipts (ADRs).
Information on delhaize group’s share price can be found on the websites of Delhaize
Group (www.delhaizegroup.com), NYSE Euronext Brussels (www. euronext.com) and
the New York Stock Exchange (www.nyse.com). Detailed information on trading activity
and share prices can also be found in the financial section of many newspapers.
SHAREHOLDER
INFORMATION
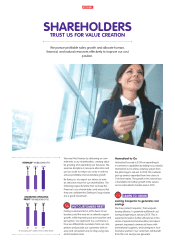
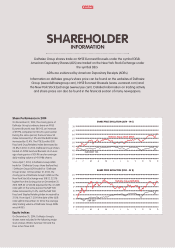
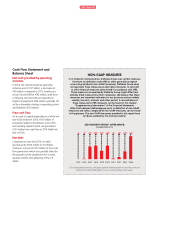
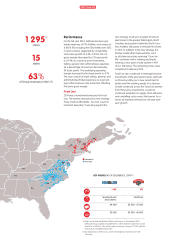
Share Performance in 2014
On December 31, 2014, the closing price of
Delhaize Group’s ordinary share on NYSE
Euronext Brussels was €60.43, an increase
of 39.9% compared to €43.20 a year earlier.
During the same period, the Euro Stoxx 50
index increased by 1.2% and the Bel20 index
increased by 12.4%. The FTSE Eurofirst 300
Food and Drug Retailers Index decreased by
23.8% in 2014. In 2014, Delhaize Group shares
traded on NYSE Euronext Brussels at an aver-
age closing price of €51.96 and an average
daily trading volume of 415 986 shares.
Since April 7, 2014, 4 Delhaize Group ADRs
trade for 1 Delhaize Group share (before that,
1 Delhaize Group ADR traded for 1 Delhaize
Group share). On December 31, 2014, the
closing price of Delhaize Group’s ADRs on the
New York Stock Exchange was $18.12, 22.0%
higher than the closing price on December 31,
2013 ($59.42 or $14.86 adjusted for the 4:1 ADR
ratio split). In the same period, the S&P 500
index increased by 11.4%, and the S&P 500
Food and Staples Retailing Index increased by
21.0%. From April 7, 2014 (the date of the ADR
ratio split) to December 31, 2014, the average
daily trading volume of Delhaize Group ADRs
was 64 855.
Equity Indices
On December 31, 2014, Delhaize Group’s
shares were included in the following major
stock indices: BEL20, Euronext 100 and the
Dow Jones Stoxx 600.
70
65
60
55
50
45
40
35
30
SHARE PRICE EVOLUTION (2014 - IN €)
J F M A M J J A S O N D
EURONEXT 100
Delhaize Group share (DELB)
SHARE PRICE EVOLUTION (2014 - IN $)
20
19
18
17
16
15
14
13
12
J F M A M J J A S O N D
S&P 500
Delhaize Group ADR (DEG)
STRATEGY