Food Lion 2014 Annual Report Download - page 5
Download and view the complete annual report
Please find page 5 of the 2014 Food Lion annual report below. You can navigate through the pages in the report by either clicking on the pages listed below, or by using the keyword search tool below to find specific information within the annual report.-
 1
1 -
 2
2 -
 3
3 -
 4
4 -
 5
5 -
 6
6 -
 7
7 -
 8
8 -
 9
9 -
 10
10 -
 11
11 -
 12
12 -
 13
13 -
 14
14 -
 15
15 -
 16
16 -
17
-
18
-
19
-
20
-
21
-
22
-
23
-
24
-
25
-
26
-
27
-
28
-
29
-
30
-
31
-
32
-
33
-
34
-
35
-
36
-
37
-
38
-
39
-
40
-
41
-
42
-
43
-
44
-
45
-
46
-
47
-
48
-
49
-
50
-
51
-
52
-
53
-
54
-
55
-
56
-
57
-
58
-
59
-
60
-
61
-
62
-
63
-
64
-
65
-
66
-
67
-
68
-
69
-
70
-
71
-
72
-
73
-
74
-
75
-
76
-
77
-
78
-
79
-
80
-
81
-
82
-
83
-
84
-
85
-
86
-
87
-
88
-
89
-
90
-
91
-
92
-
93
-
94
-
95
-
96
-
97
-
98
-
99
-
100
-
101
-
102
-
103
-
104
-
105
-
106
-
107
-
108
-
109
-
110
-
111
-
112
-
113
-
114
-
115
-
116
-
117
-
118
-
119
-
120
-
121
-
122
-
123
-
124
-
125
-
126
-
127
-
128
-
129
-
130
-
131
-
132
-
133
-
134
-
135
-
136
-
137
-
138
-
139
-
140
-
141
-
142
-
143
-
144
-
145
-
146
-
147
-
148
-
149
-
150
-
151
-
152
-
153
-
154
-
155
-
156
-
157
-
158
-
159
-
160
-
161
-
162
-
163
-
164
-
165
-
166
-
167
-
168
-
169
-
170
-
171
-
172
 |
 |

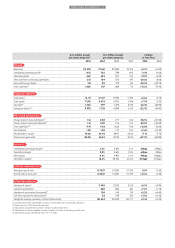
Delhaize Group Annual Report 2014 • 3
($ in millions except
per share amounts)(5)
(€ in millions except
per share amounts)
Change
vs Prior Year
2014 2014 2013 2012 2014 2013
RESULTS
Revenues 28 378 21 361 20 593 20 514 +3.7% +0.4%
Underlying operating profit(2) 1 012 762 789 845 -3.4% -6.6%
Operating profit 562 423 537 574 -21.2% -6.3%
Net profit from continuing operations 251 189 272 297 -30.5% -8.2%
Net profit (Group share) 118 89 179 105 -50.3% +70.7%
Free cash flow(2) 1 006 757 669 773 +13.2% -13.4%
FINANCIAL POSITION
Total assets 16 111 12 127 11 594 11 915 +4.6% -2.7%
Total equity 7 245 5 453 5 073 5 186 +7.5% -2.2%
Net debt(2) 1 323 997 1 473 2 072 -32.4% -28.9%
Enterprise value(2),(3) 9 578 7 210 5 899 5 155 +22.2% +14.4%
PER SHARE INFORMATION
Group share in net profit (basic)(4) 1.16 0.88 1.77 1.04 -50.5% +70.3%
Group share in net profit (diluted)(4) 1.16 0.87 1.76 1.04 -50.5% +70.0%
Free cash flow(2),(4) 9.91 7.46 6.62 7.66 +12.8% -13.6%
Net dividend 1.59 1.20 1.17 1.05 +2.6% +11.4%
Shareholders’ equity(3) 70.38 52.98 49.47 50.86 +7.1% -2.7%
Share price (year-end) 80.28 60.43 43.20 30.25 +39.9% +42.8%
RATIOS (%)
Underlying operating margin(2) 3.6% 3.8% 4.1% -26bps -29bps
Operating margin 2.0% 2.6% 2.8% -63bps -19bps
Net margin 0.4% 0.9% 0.5% -45bps +36bps
Net debt to equity(2) 18.3% 29.0% 40.0% -10.8ppt -10.9ppt
CURRENCY INFORMATION
Average € per $ rate 0.7527 0.7530 0.7783 0.0% -3.3%
€ per $ rate at year-end 0.8237 0.7251 0.7579 +13.6% -4.3%
OTHER INFORMATION
Number of stores(1) 3 402 3 225 3 075 +5.5% +4.9%
Capital expenditures 606 565 681 +7.2% -17.1%
Number of associates (thousands)(1) 150 145 139 +3.2% +4.4%
Full-time equivalents (thousands)(1) 113 109 106 +3.5% +3.5%
Weighted average number of shares (thousands) 101 434 101 029 100 777 +0.4% +0.2%
(1) Excluding the stores and related associates of divested and discontinued operations.
(2) These are non-GAAP financial measures.
(3) Calculated using the total number of shares issued at year-end.
(4) Calculated using the weighted average number of shares outstanding over the year.
(5) Calculated using an exchange rate of €1 = $1.3285.