Food Lion 2014 Annual Report Download - page 74
Download and view the complete annual report
Please find page 74 of the 2014 Food Lion annual report below. You can navigate through the pages in the report by either clicking on the pages listed below, or by using the keyword search tool below to find specific information within the annual report.-
 1
1 -
2
-
3
-
4
-
5
-
6
-
7
-
8
-
9
-
10
-
11
-
12
-
13
-
14
-
15
-
16
-
17
-
18
-
19
-
20
-
21
-
22
-
23
-
24
-
25
-
26
-
27
-
28
-
29
-
30
-
31
-
32
-
33
-
34
-
35
-
36
-
37
-
38
-
39
-
40
-
41
-
42
-
43
-
44
-
45
-
46
-
47
-
48
-
49
-
50
-
51
-
52
-
53
-
54
-
55
-
56
-
57
-
58
-
59
-
60
-
61
-
62
-
63
-
 64
64 -
 65
65 -
 66
66 -
 67
67 -
 68
68 -
 69
69 -
 70
70 -
 71
71 -
 72
72 -
 73
73 -
 74
74 -
 75
75 -
 76
76 -
 77
77 -
 78
78 -
 79
79 -
 80
80 -
 81
81 -
 82
82 -
 83
83 -
 84
84 -
85
-
86
-
87
-
88
-
89
-
90
-
91
-
92
-
93
-
94
-
95
-
96
-
97
-
98
-
99
-
100
-
101
-
102
-
103
-
104
-
105
-
106
-
107
-
108
-
109
-
110
-
111
-
112
-
113
-
114
-
115
-
116
-
117
-
118
-
119
-
120
-
121
-
122
-
123
-
124
-
125
-
126
-
127
-
128
-
129
-
130
-
131
-
132
-
133
-
134
-
135
-
136
-
137
-
138
-
139
-
140
-
141
-
142
-
143
-
144
-
145
-
146
-
147
-
148
-
149
-
150
-
151
-
152
-
153
-
154
-
155
-
156
-
157
-
158
-
159
-
160
-
161
-
162
-
163
-
164
-
165
-
166
-
167
-
168
-
169
-
170
-
171
-
172
 |
 |

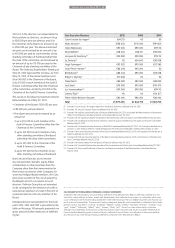
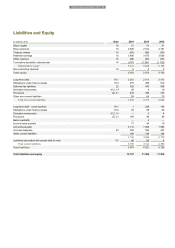
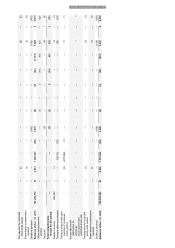
70 // DELHAIZE GROUP FINANCIAL STATEMENTS 2014
Consolidated Balance Sheet
Assets
(in millions of €)
Note
2014
2013
2012
Goodwill
6
3 147
2 959
3 189
Intangible assets
7
763
732
848
Property, plant and equipment
8
4 015
3 973
4 314
Investment property
9
84
100
116
Inve
stments accounted for using the equity method
36.2
30
24
28
Investment in securities
11
8
8
11
Other financial assets
12
21
21
19
Deferred tax assets
22
46
71
89
Derivative instruments
10.2, 19
9
1
61
Other non-current assets
49
41
50
Total non-current assets
8 172
7 930
8 725
Inventories
13
1 399
1 353
1 391
Receivables
14
623
618
632
Income tax receivables
3
4
21
Investment in securities
11
149
126
93
Other financial assets
12
18
25
—
Derivative instruments
10.2, 19
2
40
—
Prepaid expenses
72
70
74
Other current assets
29
29
41
Cash and cash equivalents
15
1 600
1 149
920
3 895
3 414
3 172
Assets classified as held for sale
5.2
60
250
18
Total current assets
3 955
3 664
3 190
Total assets
12 127
11 594
11 915
FINANCIAL STATEMENTS