Entergy 2011 Annual Report Download - page 98
Download and view the complete annual report
Please find page 98 of the 2011 Entergy annual report below. You can navigate through the pages in the report by either clicking on the pages listed below, or by using the keyword search tool below to find specific information within the annual report.-
 1
1 -
2
-
3
-
4
-
5
-
6
-
7
-
8
-
9
-
10
-
11
-
12
-
13
-
14
-
15
-
16
-
17
-
18
-
19
-
20
-
21
-
22
-
23
-
24
-
25
-
26
-
27
-
28
-
29
-
30
-
31
-
32
-
33
-
34
-
35
-
36
-
37
-
38
-
39
-
40
-
41
-
42
-
43
-
44
-
45
-
46
-
47
-
48
-
49
-
50
-
51
-
52
-
53
-
54
-
55
-
56
-
57
-
58
-
59
-
60
-
61
-
62
-
63
-
64
-
65
-
66
-
67
-
68
-
69
-
70
-
71
-
72
-
73
-
74
-
75
-
76
-
77
-
78
-
79
-
80
-
81
-
82
-
83
-
84
-
85
-
86
-
87
-
 88
88 -
 89
89 -
 90
90 -
 91
91 -
 92
92 -
 93
93 -
 94
94 -
 95
95 -
 96
96 -
 97
97 -
 98
98 -
 99
99 -
 100
100 -
 101
101 -
 102
102 -
 103
103 -
 104
104 -
 105
105 -
 106
106 -
 107
107 -
 108
108 -
109
-
110
-
111
-
112
-
113
-
114
-
115
-
116
 |
 |

NOTES TO CONSOLIDATED FINANCIAL STATEMENTS continued
The expected long term rate of return for the non-taxable
postretirement trust assets is determined using the same
methodology described above for pension assets, but the asset
allocation specific to the non-taxable postretirement assets is used.
For the taxable postretirement trust assets, the investment
allocation includes a high percentage of tax-exempt fixed income
securities. This asset allocation in combination with the same
methodology employed to determine the expected return for other
trust assets (as described above), with a modification to reflect
applicable taxes, is used to produce the expected long-term rate of
return for taxable postretirement trust assets.
Entergy currently expects long term rates of return higher
than last year’s expectation for both the non-taxable and taxable
postretirement trusts because of the planned increases to their
equity allocations in 2012.
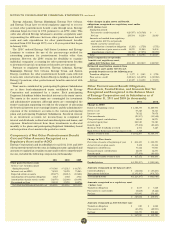
CONCENTRATIONS OF CREDIT RISK
Entergy’s investment guidelines mandate the avoidance of risk
concentrations. Types of concentrations specified to be avoided
include, but are not limited to, investment concentrations in a
single entity, type of industry, foreign country, geographic area
and individual security issuance. As of December 31, 2011 all
investment managers and assets were materially in compliance
with the approved investment guidelines, therefore there were no
significant concentrations (defined as greater than 10 percent of plan
assets) of risk in Entergy’s pension and other postretirement benefit
plan assets.
Fair Value Measurements
Accounting standards provide the framework for measuring
fair value. That framework provides a fair value hierarchy that
prioritizes the inputs to valuation techniques used to measure fair
value. The hierarchy gives the highest priority to unadjusted quoted
prices in active markets for identical assets or liabilities (level 1
measurements) and the lowest priority to unobservable inputs
(level 3 measurements).
The three levels of the fair value hierarchy are described below:
n Level 1 - Level 1 inputs are unadjusted quoted prices for identical
assets or liabilities in active markets that the Plan has the ability to
access at the measurement date. Active markets are those in which
transactions for the asset or liability occur in sufficient frequency
and volume to provide pricing information on an ongoing basis.
n Level 2 - Level 2 inputs are inputs other than quoted prices included
in Level 1 that are, either directly or indirectly, observable for the
asset or liability at the measurement date. Assets are valued based
on prices derived by an independent party that uses inputs such
as benchmark yields, reported trades, broker/dealer quotes, and
issuer spreads. Prices are reviewed and can be challenged with the
independent parties and/or overridden if it is believed such would
be more reflective of fair value. Level 2 inputs include
the following:
n quoted prices for similar assets or liabilities in active markets;
n quoted prices for identical assets or liabilities in inactive
markets;
n inputs other than quoted prices that are observable for the asset
or liability; or
n inputs that are derived principally from or corroborated by
observable market data by correlation or other means.
If an asset or liability has a specified (contractual) term, the Level 2
input must be observable for substantially the full term of the asset
or liability.
n Level 3 - Level 3 refers to securities valued based on significant
unobservable inputs.
Assets and liabilities are classified in their entirety based on the
lowest level of input that is significant to the fair value measurement.
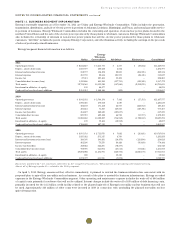
The following tables set forth by level within the fair value hierarchy
a summary of the investments held for the qualified pension and
other postretirement plans measured at fair value on a recurring
basis at December 31, 2011 and December 31, 2010 (in thousands):
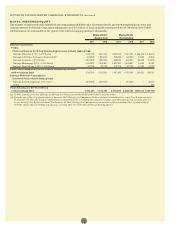
Qualified Pension Trust
2011 Level 1 Level 2 Level 3 Total
Equity securities:
Corporate stocks:
Preferred $ 3,738(b) $ 8,014(a) $– $ 11,752
Common 1,010,491(b) – – 1,010,491
Common collective trusts(a) – 1,074,178(c) – 1,074,178
Fixed income securities:
U.S. government securities 142,509(b) 157,737(a) – 300,246
Corporate debt instruments – 380,558 _ 380,558
Registered investment
companies 53,323(d) 444,275 – 497,598
Other – 101,674(b) – 101,674
Other:
Insurance company
general account
(unallocated contracts) – 34,696(g) – 34,696
Total investments $1,210,061 $2,201,132 $– $3,411,193
Cash 75
Other pending transactions (9,238)
Less: Other postretirement
assets included in total
investments (2,114)
Total fair value of
qualified pension assets $3,399,916
96