Entergy 2011 Annual Report Download - page 35
Download and view the complete annual report
Please find page 35 of the 2011 Entergy annual report below. You can navigate through the pages in the report by either clicking on the pages listed below, or by using the keyword search tool below to find specific information within the annual report.-
 1
1 -
2
-
3
-
4
-
5
-
6
-
7
-
8
-
9
-
10
-
11
-
12
-
13
-
14
-
15
-
16
-
17
-
18
-
19
-
20
-
21
-
22
-
23
-
24
-
 25
25 -
 26
26 -
 27
27 -
 28
28 -
 29
29 -
 30
30 -
 31
31 -
 32
32 -
 33
33 -
 34
34 -
 35
35 -
 36
36 -
 37
37 -
 38
38 -
 39
39 -
 40
40 -
 41
41 -
 42
42 -
 43
43 -
 44
44 -
 45
45 -
46
-
47
-
48
-
49
-
50
-
51
-
52
-
53
-
54
-
55
-
56
-
57
-
58
-
59
-
60
-
61
-
62
-
63
-
64
-
65
-
66
-
67
-
68
-
69
-
70
-
71
-
72
-
73
-
74
-
75
-
76
-
77
-
78
-
79
-
80
-
81
-
82
-
83
-
84
-
85
-
86
-
87
-
88
-
89
-
90
-
91
-
92
-
93
-
94
-
95
-
96
-
97
-
98
-
99
-
100
-
101
-
102
-
103
-
104
-
105
-
106
-
107
-
108
-
109
-
110
-
111
-
112
-
113
-
114
-
115
-
116
 |
 |

Entergy Corporation and Subsidiaries 2011
The purchased power capacity variance is primarily due to price
increases for ongoing purchased power capacity and additional
capacity purchases.
The net wholesale revenue variance is primarily due to lower
margins on co-owner contracts and higher wholesale energy costs.
The volume/weather variance is primarily due to an increase of
2,061 GWh in weather-adjusted usage across all sectors. Weather-
adjusted residential retail sales growth reflected an increase in the
number of customers. Industrial sales growth has continued since
the beginning of 2010. Entergy’s service territory has benefited
from the national manufacturing economy and exports, as well
as industrial facility expansions. Increases have been offset to
some extent by declines in the paper, wood products, and pipeline
segments. The increase was also partially offset by the effect of less
favorable weather on residential sales.
The ANO decommissioning trust variance is primarily related to the
deferral of investment gains from the ANO 1 and 2 decommissioning
trust in 2010 in accordance with regulatory treatment. The gains
resulted in an increase in interest and investment income in 2010
and a corresponding increase in regulatory charges with no effect
on net income.
The retail electric price variance is primarily due to:
n rate actions at Entergy Texas, including a base rate increase
effective August 2010 and an additional increase beginning
May 2011;
n a formula rate plan increase at Entergy Louisiana effective
May 2011; and
n a base rate increase at Entergy Arkansas effective July 2010.
These were partially offset by formula rate plan decreases at Entergy
New Orleans effective October 2010 and October 2011. See Note 2 to
the financial statements for further discussion of these proceedings.
Entergy Wholesale Commodities
Following is an analysis of the change in net revenue comparing 2011
to 2010 (in millions):
2010 Net Revenue $2,200
Realized price changes (159)
Fuel expenses (30)
Harrison County (27)
Volume 60
2011 Net Revenue $2,044
As shown in the table above, net revenue for Entergy Wholesale
Commodities decreased by $156 million, or 7%, in 2011 compared to
2010 primarily due to:
n lower pricing in its contracts to sell power;
n higher fuel expenses, primarily at the nuclear plants; and
n the absence of the Harrison County plant, which was sold in
December 2010.
These factors were partially offset by higher volume resulting from
fewer planned and unplanned outage days in 2011 compared to the
same period in 2010.
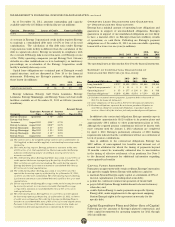
Following are key performance measures for Entergy Wholesale
Commodities for 2011 and 2010:
2011 2010
Owned capacity 6,599 6,351
GWh billed 43,520 42,682
Average realized price per MWh $54.48 $59.04
Entergy Wholesale Commodities Nuclear Fleet
Capacity factor 93% 90%
GWh billed 40,918 39,655
Average realized revenue per MWh $54.73 $59.16
Refueling outage days:
FitzPatrick – 35
Indian Point 2 – 33
Indian Point 3 30 –
Palisades – 26
Pilgrim 25 –
Vermont Yankee 25 29
Realized Revenue per MWh for Entergy Wholesale
Commodities Nuclear Plants
The recent economic downturn and negative trends in the energy
commodity markets have resulted in lower natural gas prices and
therefore lower market prices for electricity in the New York and
New England power regions, which is where five of the six Entergy
Wholesale Commodities nuclear power plants are located. Entergy
Wholesale Commodities’ nuclear business experienced a decrease
in realized price per MWh to $54.73 in 2011 from $59.16 in 2010,
and is likely to experience a decrease again in 2012 because, as
shown in the contracted sale of energy table in “Market and Credit
Risk Sensitive Instruments,” Entergy Wholesale Commodities has
sold forward 88% of its planned nuclear energy output for 2012 for
an average contracted energy price of $49 per MWh. In addition,
Entergy Wholesale Commodities has sold forward 81% of its
planned energy output for 2013 for an average contracted energy
price range of $45-50 per MWh.
OTH E R INCO M E STATE M E NT ITE M S
Utility
Other operation and maintenance expenses increased from $1,949
million for 2010 to $1,951 million for 2011 primarily due to:
n an increase of $17 million in nuclear expenses primarily due to
higher labor costs, including higher contract labor;
n an increase of $15 million in contract costs due to the transition
and implementation of joining the MISO RTO;
n an increase of $9 million in legal expenses primarily resulting
from an increase in legal and regulatory activity increasing the
use of outside legal services;
n an increase of $8 million in fossil-fueled generation expenses
primarily due to the addition of Acadia Unit 2 in April 2011; and
n several individually insignificant items.
These increases were substantially offset by:
n a decrease of $29 million in compensation and benefits costs
primarily resulting from an increase in the accrual for incentive-
based compensation in 2010 and a decrease in stock option
expense. The decrease in stock option expense is offset by
credits recorded by the parent company, Entergy Corporation;
MANAGEMENT’S FINANCIAL DISCUSSION AND ANALYSIS continued
33