Entergy 2011 Annual Report Download - page 97
Download and view the complete annual report
Please find page 97 of the 2011 Entergy annual report below. You can navigate through the pages in the report by either clicking on the pages listed below, or by using the keyword search tool below to find specific information within the annual report.-
 1
1 -
2
-
3
-
4
-
5
-
6
-
7
-
8
-
9
-
10
-
11
-
12
-
13
-
14
-
15
-
16
-
17
-
18
-
19
-
20
-
21
-
22
-
23
-
24
-
25
-
26
-
27
-
28
-
29
-
30
-
31
-
32
-
33
-
34
-
35
-
36
-
37
-
38
-
39
-
40
-
41
-
42
-
43
-
44
-
45
-
46
-
47
-
48
-
49
-
50
-
51
-
52
-
53
-
54
-
55
-
56
-
57
-
58
-
59
-
60
-
61
-
62
-
63
-
64
-
65
-
66
-
67
-
68
-
69
-
70
-
71
-
72
-
73
-
74
-
75
-
76
-
77
-
78
-
79
-
80
-
81
-
82
-
83
-
84
-
85
-
86
-
 87
87 -
 88
88 -
 89
89 -
 90
90 -
 91
91 -
 92
92 -
 93
93 -
 94
94 -
 95
95 -
 96
96 -
 97
97 -
 98
98 -
 99
99 -
 100
100 -
 101
101 -
 102
102 -
 103
103 -
 104
104 -
 105
105 -
 106
106 -
 107
107 -
108
-
109
-
110
-
111
-
112
-
113
-
114
-
115
-
116
 |
 |

Entergy Corporation and Subsidiaries 2011
NOTES TO CONSOLIDATED FINANCIAL STATEMENTS continued
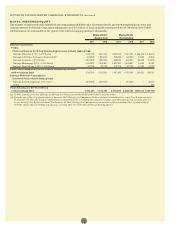
Non-Qualified Pension Plans
Entergy also sponsors non-qualified, non-contributory defined
benefit pension plans that provide benefits to certain key employees.
Entergy recognized net periodic pension cost related to these plans
of $24 million in 2011, $27.2 million in 2010, and $23.6 million in
2009. In 2011, 2010 and 2009 Entergy recognized $4.6 million, $9.3
million and $6.7 million, respectively in settlement charges related
to the payment of lump sum benefits out of the plan that is included
in the non-qualified pension plan cost above. The projected benefit
obligation was $164.4 million and $148.3 million as of December 31,
2011 and 2010, respectively. The accumulated benefit obligation was
$146.5 million and $131.6 million as of December 31, 2011 and 2010,
respectively.
Entergy’s non-qualified, non-current pension liability at December
31, 2011 and 2010 was $153.2 million and $138.7 million, respectively;
and its current liability was $11.2 million and $9.6 million, respectively.
The unamortized transition asset, prior service cost and net loss are
recognized in regulatory assets ($58.9 million at December 31, 2011
and $53.5 million at December 31, 2010) and accumulated other
comprehensive income before taxes ($27.2 million at December 31,
2011 and $24.3 million at December 31, 2010).
Accounting for Pension and Other
Postretirement Benefits
Accounting standards require an employer to recognize in its balance
sheet the funded status of its benefit plans. This is measured as the
difference between plan assets at fair value and the benefit obligation.
Entergy uses a December 31 measurement date for its pension and
other postretirement plans. Employers are to record previously
unrecognized gains and losses, prior service costs, and any remaining
transition asset or obligation (that resulted from adopting prior
pension and other postretirement benefits accounting standards) as
comprehensive income and/or as a regulatory asset reflective of the
recovery mechanism for pension and other postretirement benefit
costs in the Utility’s jurisdictions. For the portion of Entergy Gulf
States Louisiana that is not regulated, the unrecognized prior service
cost, gains and losses, and transition asset/obligation for its pension
and other postretirement benefit obligations are recorded as other
comprehensive income. Entergy Gulf States Louisiana and Entergy
Louisiana recover other postretirement benefit costs on a pay as you
go basis and record the unrecognized prior service cost, gains and
losses, and transition obligation for its other postretirement benefit
obligation as other comprehensive income. Accounting standards
also requires that changes in the funded status be recorded as other
comprehensive income and/or a regulatory asset in the period in
which the changes occur.
With regard to pension and other postretirement costs, Entergy
calculates the expected return on pension and other postretirement
benefit plan assets by multiplying the long term expected rate of
return on assets by the market-related value (MRV) of plan assets.
Entergy determines the MRV of pension plan assets by calculating
a value that uses a 20-quarter phase-in of the difference between
actual and expected returns. For other postretirement benefit plan
assets Entergy uses fair value when determining MRV.
Qualified Pension and Other Postretirement
Plans’ Assets
The Plan Administrator’s trust asset investment strategy is to invest
the assets in a manner whereby long term earnings on the assets
(plus cash contributions) provide adequate funding for retiree
benefit payments. The mix of assets is based on an optimization
study that identifies asset allocation targets in order to achieve the
maximum return for an acceptable level of risk, while minimizing the
expected contributions and pension and postretirement expense.
The Plan Administrator approved a new asset allocation and
implementation of an optimization study in 2011 for the pension
assets. The optimization study recommended that the target asset
allocation adjust dynamically based on the funded status of the plan.
The study identifies updated asset allocation targets to maximize
return on the assets within a prudent level of risk, as mentioned
above, and to maintain a level of volatility that is not expected
to have material impact on Entergy’s expected contribution and
expense. Entergy has begun to adjust its asset allocation, and those
adjustments are reflected in the target and actual asset allocations
listed below.
Entergy also completed an optimization study in 2011 for the
postretirement assets that identifies new asset allocation targets.
Entergy plans to adjust to this asset allocation during 2012, and the
target asset allocation will be 39% domestic equity securities, 26%
international equity securities and 35% fixed income securities for all
trusts, taxable and non-taxable.
In the optimization studies, the Plan Administrator formulates
assumptions about characteristics, such as expected asset class
investment returns, volatility (risk), and correlation coefficients
among the various asset classes. The future market assumptions
used in the optimization study are determined by examining
historical market characteristics of the various asset classes, and
making adjustments to reflect future conditions expected to prevail
over the study period. The following targets and ranges were
established to produce an acceptable, economically efficient plan to
manage around the targets. The target asset allocation range below
for pension shows the ranges within which the allocation may adjust
based on funded status, with the expectation that the allocation
to fixed income securities will increase as the pension funded
status increases.
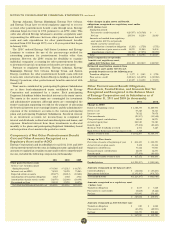
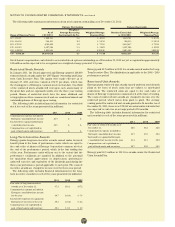
Entergy’s qualified pension and postretirement weighted-average
asset allocations by asset category at December 31, 2011 and 2010
and the target asset allocation and ranges for those time periods are
as follows:
Pension Asset Allocation Target Range 2011 2010
Domestic Equity Securities 45% 34% to 53% 44% 44%
International Equity Securities 20% 16% to 24% 18% 20%
Fixed-Income Securities 35% 31% to 41% 37% 35%
Other –% –% to 10% 1% 1%
Non-Taxable Taxable
Postretirement
Asset Allocation Target Range 2011 2010 Target Range 2011 2010
Domestic
Equity Securities 38% 33% to 43% 39% 39% 35% 30% to 40% 35% 39%
International
Equity Securities 17% 12% to 22% 15% 18% –% –% –% –%
Fixed-Income
Securities 45% 40% to 50% 46% 43% 65% 60% to 70% 64% 60%
Other –% –% to 5% –% –% –% –% to 5% 1% 1%
In determining its expected long term rate of return on plan
assets used in the calculation of benefit plan costs, Entergy reviews
past performance, current and expected future asset allocations,
and capital market assumptions of its investment consultant and
investment managers.
The expected long term rate of return for the qualified pension
plans’ assets is based on the geometric average of the historical
annual performance of a representative portfolio weighted by the
target asset allocation defined in the table above. The time period
reflected is a long dated period spanning several decades.
95