Entergy 2011 Annual Report Download - page 59
Download and view the complete annual report
Please find page 59 of the 2011 Entergy annual report below. You can navigate through the pages in the report by either clicking on the pages listed below, or by using the keyword search tool below to find specific information within the annual report.-
 1
1 -
2
-
3
-
4
-
5
-
6
-
7
-
8
-
9
-
10
-
11
-
12
-
13
-
14
-
15
-
16
-
17
-
18
-
19
-
20
-
21
-
22
-
23
-
24
-
25
-
26
-
27
-
28
-
29
-
30
-
31
-
32
-
33
-
34
-
35
-
36
-
37
-
38
-
39
-
40
-
41
-
42
-
43
-
44
-
45
-
46
-
47
-
48
-
 49
49 -
 50
50 -
 51
51 -
 52
52 -
 53
53 -
 54
54 -
 55
55 -
 56
56 -
 57
57 -
 58
58 -
 59
59 -
 60
60 -
 61
61 -
 62
62 -
 63
63 -
 64
64 -
 65
65 -
 66
66 -
 67
67 -
 68
68 -
 69
69 -
70
-
71
-
72
-
73
-
74
-
75
-
76
-
77
-
78
-
79
-
80
-
81
-
82
-
83
-
84
-
85
-
86
-
87
-
88
-
89
-
90
-
91
-
92
-
93
-
94
-
95
-
96
-
97
-
98
-
99
-
100
-
101
-
102
-
103
-
104
-
105
-
106
-
107
-
108
-
109
-
110
-
111
-
112
-
113
-
114
-
115
-
116
 |
 |

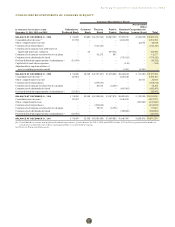
Entergy Corporation and Subsidiaries 2011
Common Shareholders’ Equity
Accumulated
Other
In thousands, for the years ended Subsidiaries’ Common Treasury Paid–in Retained Comprehensive
December 31, 2011, 2010, and 2009 Preferred Stock Stock Stock Capital Earnings Income (Loss) Total
BALANCE AT DECEMBER 31, 2008 $ 94,000 $2,482 $(4,175,214) $4,869,303 $7,382,719 $(112,698) $8,060,592
Consolidated net income(a) 19,958 – – – 1,231,092 – 1,251,050
Other comprehensive income – – – – – 43,878 43,878
Common stock repurchases – – (613,125) – – – (613,125)
Common stock issuances in settlement of
equity unit purchase contracts – 66 – 499,934 – – 500,000
Common stock issuances related to stock plans – – 61,172 805 – – 61,977
Common stock dividends declared – – – – (576,913) – (576,913)
Preferred dividend requirements of subsidiaries(a) (19,958) – – – – – (19,958)
Capital stock and other expenses – – – – (141) – (141)
Adjustment for implementation of
new accounting pronouncement – – – – 6,365 (6,365) –
BALANCE AT DECEMBER 31, 2009 $ 94,000 $2,548 $(4,727,167) $5,370,042 $8,043,122 $ (75,185) $ 8,707,360
Consolidated net income(a) 20,063 – – – 1,250,242 – 1,270,305
Other comprehensive income – – – – – 36,973 36,973
Common stock repurchases – – (878,576) – – – (878,576)
Common stock issuances related to stock plans – – 80,932 (2,568) – – 78,364
Common stock dividends declared – – – – (603,963) – (603,963)
Preferred dividend requirements of subsidiaries(a) (20,063) – – – – – (20,063)
BALANCE AT DECEMBER 31, 2010 $ 94,000 $2,548 $(5,524,811) $5,367,474 $8,689,401 $ (38,212) $8,590,400
Consolidated net income(a) 20,933 – – – 1,346,439 – 1,367,372
Other comprehensive loss – – – – – (130,240) (130,240)
Common stock repurchases – – (234,632) – – – (234,632)
Common stock issuances related to stock plans – – 78,975 (6,792) – – 72,183
Common stock dividends declared – – – – (588,880) – (588,880)
Preferred dividend requirements of subsidiaries(a) (20,933) – – – – – (20,933)
BALANCE AT DECEMBER 31, 2011 $ 94,000 $2,548 $(5,680,468) $5,360,682 $9,446,960 $(168,452) $9,055,270
(a) Consolidated net income and preferred dividend requirements of subsidiaries for 2011, 2010, and 2009 include $13.3 million of preferred dividends on
subsidiaries’ preferred stock without sinking fund that is not presented as equity.
See Notes to Financial Statements.
CONSOLIDATED STATEMENTS OF CHANGES IN EQUITY
57