Entergy 2011 Annual Report Download - page 62
Download and view the complete annual report
Please find page 62 of the 2011 Entergy annual report below. You can navigate through the pages in the report by either clicking on the pages listed below, or by using the keyword search tool below to find specific information within the annual report.-
 1
1 -
2
-
3
-
4
-
5
-
6
-
7
-
8
-
9
-
10
-
11
-
12
-
13
-
14
-
15
-
16
-
17
-
18
-
19
-
20
-
21
-
22
-
23
-
24
-
25
-
26
-
27
-
28
-
29
-
30
-
31
-
32
-
33
-
34
-
35
-
36
-
37
-
38
-
39
-
40
-
41
-
42
-
43
-
44
-
45
-
46
-
47
-
48
-
49
-
50
-
51
-
 52
52 -
 53
53 -
 54
54 -
 55
55 -
 56
56 -
 57
57 -
 58
58 -
 59
59 -
 60
60 -
 61
61 -
 62
62 -
 63
63 -
 64
64 -
 65
65 -
 66
66 -
 67
67 -
 68
68 -
 69
69 -
 70
70 -
 71
71 -
 72
72 -
73
-
74
-
75
-
76
-
77
-
78
-
79
-
80
-
81
-
82
-
83
-
84
-
85
-
86
-
87
-
88
-
89
-
90
-
91
-
92
-
93
-
94
-
95
-
96
-
97
-
98
-
99
-
100
-
101
-
102
-
103
-
104
-
105
-
106
-
107
-
108
-
109
-
110
-
111
-
112
-
113
-
114
-
115
-
116
 |
 |

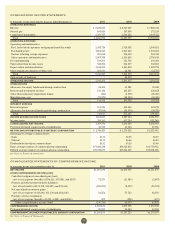
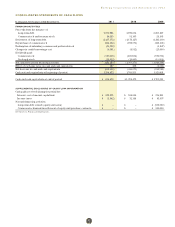
CONSOLIDATED STATEMENTS OF CASH FLOWS
In thousands, for the years ended December 31, 2011 2010 2009
OPERATING ACTIVITIES
Consolidated net income $ 1,367,372 $ 1,270,305 $ 1,251,050
Adjustments to reconcile consolidated net income to net cash flow
provided by operating activities:
Depreciation, amortization, and decommissioning,
including nuclear fuel amortization 1,745,455 1,705,331 1,458,861
Deferred income taxes, investment tax credits,
and non-current taxes accrued (280,029) 718,987 864,684
Gain on sale of business – (44,173) –
Changes in working capital:
Receivables 28,091 (99,640) 116,444
Fuel inventory 5,393 (10,665) 19,291
Accounts payable (131,970) 216,635 (14,251)
Prepaid taxes and taxes accrued 580,042 (116,988) (260,029)
Interest accrued (34,172) 17,651 4,974
Deferred fuel (55,686) 8,909 72,314
Other working capital accounts 41,875 (160,326) (43,391)
Change in provisions for estimated losses (11,086) 265,284 (12,030)
Change in other regulatory assets (673,244) 339,408 (415,157)
Change in pensions and other postretirement liabilities 962,461 (80,844) 71,789
Other (415,685) (103,793) (181,391)
Net cash flow provided by operating activities 3,128,817 3,926,081 2,933,158
INVESTING ACTIVITIES
Construction/capital expenditures (2,040,027) (1,974,286) (1,931,245)
Allowance for equity funds used during construction 86,252 59,381 59,545
Nuclear fuel purchases (641,493) (407,711) (525,474)
Proceeds from sale/leaseback of nuclear fuel – – 284,997
Proceeds from sale of assets and businesses 6,531 228,171 39,554
Payment for purchases of plants (646,137) – –
Insurance proceeds received for property damages – 7,894 53,760
Changes in transition charge account (7,260) (29,945) (1,036)
NYPA value sharing payment (72,000) (72,000) (72,000)
Payments to storm reserve escrow account (6,425) (296,614) (6,802)
Receipts from storm reserve escrow account – 9,925 –
Decrease (increase) in other investments (11,623) 24,956 100,956
Proceeds from nuclear decommissioning trust fund sales 1,360,346 2,606,383 2,570,523
Investment in nuclear decommissioning trust funds (1,475,017) (2,730,377) (2,667,172)
Net cash flow used in investing activities (3,446,853) (2,574,223) (2,094,394)
See Notes to Financial Statements.
60