Entergy 2011 Annual Report Download - page 47
Download and view the complete annual report
Please find page 47 of the 2011 Entergy annual report below. You can navigate through the pages in the report by either clicking on the pages listed below, or by using the keyword search tool below to find specific information within the annual report.-
 1
1 -
2
-
3
-
4
-
5
-
6
-
7
-
8
-
9
-
10
-
11
-
12
-
13
-
14
-
15
-
16
-
17
-
18
-
19
-
20
-
21
-
22
-
23
-
24
-
25
-
26
-
27
-
28
-
29
-
30
-
31
-
32
-
33
-
34
-
35
-
36
-
 37
37 -
 38
38 -
 39
39 -
 40
40 -
 41
41 -
 42
42 -
 43
43 -
 44
44 -
 45
45 -
 46
46 -
 47
47 -
 48
48 -
 49
49 -
 50
50 -
 51
51 -
 52
52 -
 53
53 -
 54
54 -
 55
55 -
 56
56 -
 57
57 -
58
-
59
-
60
-
61
-
62
-
63
-
64
-
65
-
66
-
67
-
68
-
69
-
70
-
71
-
72
-
73
-
74
-
75
-
76
-
77
-
78
-
79
-
80
-
81
-
82
-
83
-
84
-
85
-
86
-
87
-
88
-
89
-
90
-
91
-
92
-
93
-
94
-
95
-
96
-
97
-
98
-
99
-
100
-
101
-
102
-
103
-
104
-
105
-
106
-
107
-
108
-
109
-
110
-
111
-
112
-
113
-
114
-
115
-
116
 |
 |

Entergy Corporation and Subsidiaries 2011
MANAGEMENT’S FINANCIAL DISCUSSION AND ANALYSIS continued
These increases were offset by the investment in 2010 of a total of
$290 million in Entergy Gulf States Louisiana’s and Entergy Louisiana’s
storm reserve escrow accounts as a result of their Act 55 storm cost
financings, which are discussed in Note 2 to the financial statements.
2010 Compared to 2009
Net cash used in investing activities increased $480 million in 2010
compared to 2009 primarily due to the following activity:
n an increase in net uses of cash for nuclear fuel purchases, which
was caused by the consolidation of the nuclear fuel company
variable interest entities that is discussed in Note 18 to the
financial statements. With the consolidation of the nuclear fuel
company variable interest entities, their purchases of nuclear
fuel from Entergy are now eliminated in consolidation, whereas
before 2010 they were a source of investing cash flows;
n the investment of a total of $290 million in Entergy Gulf States
Louisiana’s and Entergy Louisiana’s storm reserve escrow
accounts as a result of their Act 55 storm cost financings, which
are discussed in Note 2 to the financial statements;
n an increase in construction expenditures, primarily in the
Entergy Wholesale Commodities business, as decreases for
the Utility resulting from Hurricane Gustav, Hurricane Ike, and
Arkansas ice storm restoration spending in 2009 were offset by
spending on various projects; and
n the sale of an Entergy Wholesale Commodities subsidiary’s
ownership interest in the Harrison County Power Project for
proceeds of $219 million in 2010. The sale is described in more
detail in Note 15 to the financial statements.
FINA N C I N G ACTIVITIES
2011 Compared to 2010
Net cash used in financing activities decreased $1,485 million in 2011
compared to 2010 primarily because long-term debt activity provided
approximately $554 million of cash in 2011 and used approximately
$307 million of cash in 2010. The most significant long-term debt
activity in 2011 included the issuance of $207 million of securitization
bonds by a subsidiary of Entergy Louisiana, the issuance of $200
million of first mortgage bonds by Entergy Louisiana, and Entergy
Corporation increasing the borrowings outstanding on its 5-year
credit facility by $288 million. For the details of Entergy’s long-term
debt outstanding on December 31, 2011 and 2010 see Note 5 to the
financial statements herein. In addition to the long-term debt activity,
Entergy Corporation repurchased $236 million of its common stock
in 2011 and repurchased $879 million of its common stock in 2010.
Entergy’s stock repurchases are discussed further in the “Capital
Expenditure Plans and Other Uses of Capital - Dividends and Stock
Repurchases” section above.
2010 Compared to 2009
Net cash used in financing activities increased $719 million in
2010 compared to 2009 primarily because long-term debt activity
used approximately $307 million of cash in 2010 and provided
approximately $160 million of cash in 2009. The most significant net
use for long-term debt activity was by Entergy Corporation, which
reduced its 5-year credit facility balance by $934 million and repaid
a total of $275 million of notes and bank term loans, while issuing
$1 billion of notes in 2010. For the details of Entergy’s long-term debt
outstanding see Note 5 to the financial statements herein. In addition,
Entergy Corporation repurchased $879 million of its common stock
in 2010 and repurchased $613 million of its common stock in 2009.
Entergy’s stock repurchases are discussed further in the “Capital
Expenditure Plans and Other Uses of Capital - Dividends and Stock
Repurchases” section above.
RATE, COST-RECOVERY AND
OTHER REGUL ATION
State and Local Rate Regulation and
Fuel-Cost Recovery
The rates that the Utility operating companies and System Energy
charge for their services significantly influence Entergy’s financial
position, results of operations, and liquidity. These companies are
regulated and the rates charged to their customers are determined
in regulatory proceedings. Governmental agencies, including the
APSC, the City Council, the LPSC, the MPSC, the PUCT, and the
FERC, are primarily responsible for approval of the rates charged
to customers. Following is a summary of the Utility operating
companies’ authorized returns on common equity and current
retail base rates. The Utility operating companies’ base rate, fuel
and purchased power cost recovery, and storm cost recovery
proceedings are discussed in Note 2 to the financial statements.
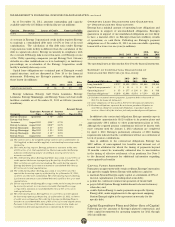
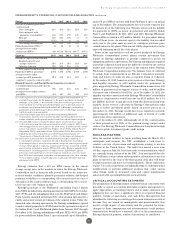
The following chart summarizes the utility operating companies’ current retail base rates:
Authorized
Company Return on Common Equity
Entergy Arkansas 10.2% n Current retail base rates implemented in the July 2010 billing cycle
pursuant to a settlement approved by the APSC.
Entergy Gulf States Louisiana 9.9% - 11.4% Electric; n Current retail electric base rates implemented based on Entergy
Gulf States Louisiana’s 2010 test year formula rate plan filing
approved by the LPSC.
10.0% - 11.0% Gas n Current retail gas base rates reflect the rate stabilization plan filing
for the 2010 test year ended September 2010.
Entergy Louisiana 9.45% - 11.05% n Current retail base rates based on Entergy Louisiana’s 2010 test
year formula rate plan filing approved by the LPSC.
Entergy Mississippi 10.54% - 12.72% n Current retail base rates reflect Entergy Mississippi’s latest
formula rate plan filing, based on the 2010 test year, and a
stipulation approved by the MPSC.
Entergy New Orleans 10.7% - 11.5% Electric;
n Current retail base rates reflect Entergy New Orleans’s 2010 test
10.25% - 11.25% Gas year formula rate plan filing and a settlement approved by the
City Council.
Entergy Texas 10.125% n Current retail base rates reflect Entergy Texas’s 2009 base rate case
filing and a settlement approved by the PUCT.
45