Entergy 2011 Annual Report Download - page 81
Download and view the complete annual report
Please find page 81 of the 2011 Entergy annual report below. You can navigate through the pages in the report by either clicking on the pages listed below, or by using the keyword search tool below to find specific information within the annual report.-
 1
1 -
2
-
3
-
4
-
5
-
6
-
7
-
8
-
9
-
10
-
11
-
12
-
13
-
14
-
15
-
16
-
17
-
18
-
19
-
20
-
21
-
22
-
23
-
24
-
25
-
26
-
27
-
28
-
29
-
30
-
31
-
32
-
33
-
34
-
35
-
36
-
37
-
38
-
39
-
40
-
41
-
42
-
43
-
44
-
45
-
46
-
47
-
48
-
49
-
50
-
51
-
52
-
53
-
54
-
55
-
56
-
57
-
58
-
59
-
60
-
61
-
62
-
63
-
64
-
65
-
66
-
67
-
68
-
69
-
70
-
 71
71 -
 72
72 -
 73
73 -
 74
74 -
 75
75 -
 76
76 -
 77
77 -
 78
78 -
 79
79 -
 80
80 -
 81
81 -
 82
82 -
 83
83 -
 84
84 -
 85
85 -
 86
86 -
 87
87 -
 88
88 -
 89
89 -
 90
90 -
 91
91 -
92
-
93
-
94
-
95
-
96
-
97
-
98
-
99
-
100
-
101
-
102
-
103
-
104
-
105
-
106
-
107
-
108
-
109
-
110
-
111
-
112
-
113
-
114
-
115
-
116
 |
 |

Entergy Corporation and Subsidiaries 2011
NOTES TO CONSOLIDATED FINANCIAL STATEMENTS continued
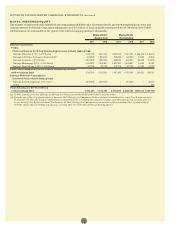
NOTE 3. INCOME TAXES
Income tax expenses from continuing operations for 2011, 2010,
and 2009 for Entergy Corporation and Subsidiaries consist of the
following (in thousands):
2011 2010 2009
Current:
Federal $ 452,713 $ 145,161 $ (433,105)
Foreign 130 131 154
State 152,711 19,313 (108,552)
Total 605,554 164,605 (541,503)
Deferred and non-current - net (311,708) 468,698 1,191,418
Investment tax credit
adjustments - net (7,583) (16,064) (17,175)
Income tax expense from
continuing operations $286,263 $617,239 $ 632,740
Total income taxes for Entergy Corporation and Subsidiaries differ
from the amounts computed by applying the statutory income tax rate
to income before taxes. The reasons for the differences for the years
2011, 2010, and 2009 are (in thousands):
2011 2010 2009
Net income attributable to
Entergy Corporation $1,346,439 $1,250,242 $1,231,092
Preferred dividend
requirements of subsidiaries 20,933 20,063 19,958
Consolidated net income 1,367,372 1,270,305 1,251,050
Income taxes 286,263 617,239 632,740
Income before income taxes $1,653,635 $1,887,544 $1,883,790
Computed at statutory
rate (35%) $ 578,772 $ 660,640 $ 659,327
Increases (reductions) in tax
resulting from:
State income taxes net of
federal income tax effect 93,940 40,530 65,241|
Regulatory differences -
utility plant items 39,970 31,473 57,383
Equity component of AFUDC (30,184) (16,542) (17,741)
Amortization of investment
tax credits (14,962) (15,980) (16,745)
Net-of-tax regulatory liability(a) 65,357 – –
Deferred tax reversal on
PPA settlement(a) (421,819) – –
Write-off of
reorganization costs – (19,974) –
Tax law change-Medicare
Part D – 13,616 –
Decommissioning
trust fund basis – – (7,917)
Capital gains (losses) – – (28,051)
Flow-through/permanent
differences (17,848) (26,370) (31,745)
Provision for uncertain
tax positions 2,698 (43,115) (17,435)
Valuation allowance – – (40,795)
Other - net (9,661) (7,039) 11,218
Total income
taxes as reported $ 286,263 $ 617,239 $632,740
Effective income tax rate 17.3% 32.7% 33.6%
(a) See “Income Tax Audits - 2006-2007 Audit” below for discussion of these items.
Significant components of accumulated deferred income taxes
and taxes accrued for Entergy Corporation and Subsidiaries as of
December 31, 2011 and 2010 are as follows (in thousands):
2011 2010
Deferred tax liabilities:
Plant basis differences - net $ (7,349,990) $ (6,572,627)
Regulatory assets for income taxes - net (430,807) (449,266)
Power purchase agreements (17,138) (265,429)
Nuclear decommissioning trusts (553,558) (439,481)
Other (686,006) (679,302)
Total (9,037,499) (8,406,105)
Deferred tax assets:
Accumulated deferred investment
tax credit 108,338 111,170
Pension and other post-employment benefits 315,134 161,730
Nuclear decommissioning liabilities 612,945 285,889
Sale and leaseback 217,430 256,157
Provision for regulatory adjustments 97,607 100,504
Provision for contingencies 28,504 28,554
Unbilled/deferred revenues 12,217 18,642
Customer deposits 14,825 15,724
Net operating loss carryforwards 253,518 123,710
Capital losses 12,995 56,602
Other 96,676 19,009
Valuation allowance (85,615) (70,089)
Total 1,684,574 1,107,602
Noncurrent accrued taxes (including
unrecognized tax benefits) $ (814,597) $ (1,261,455)
Accumulated deferred income
taxes accrued $(8,167,522) $(8,559,958)
Entergy’s estimated tax attribute carryovers and their expiration
dates as of December 31, 2011 are as follows:
Carryover Description Carryover Amount Year(s) of expiration
Federal net operating losses $ 9 billion 2023 - 2031
State net operating losses $ 8 billion 2012 - 2031
State capital losses $162 million 2013 - 2015
Federal minimum tax credits $ 79 million never
Other federal and state credits $ 80 million 2012 - 2031
As a result of the accounting for uncertain tax positions,
the amount of the deferred tax assets reflected in the financial
statements is less than the amount of the tax effect of the federal
and state net operating loss carryovers, tax credit carryovers, and
other tax attributes reflected on income tax returns.
Because it is more likely than not that the benefit from certain
state net operating and capital loss carryovers will not be utilized, a
valuation allowance of $66 million and $13 million has been provided
on the deferred tax assets relating to these state net operating and
capital loss carryovers, respectively.
Unrecognized Tax Benefits
Accounting standards establish a “more-likely-than-not” recognition
threshold that must be met before a tax benefit can be recognized in
the financial statements. If a tax deduction is taken on a tax return,
but does not meet the more-likely-than-not recognition threshold,
an increase in income tax liability, above what is payable on the
tax return, is required to be recorded. A reconciliation of Entergy’s
79