Entergy 2011 Annual Report Download - page 25
Download and view the complete annual report
Please find page 25 of the 2011 Entergy annual report below. You can navigate through the pages in the report by either clicking on the pages listed below, or by using the keyword search tool below to find specific information within the annual report.-
 1
1 -
2
-
3
-
4
-
5
-
6
-
7
-
8
-
9
-
10
-
11
-
12
-
13
-
14
-
 15
15 -
 16
16 -
 17
17 -
 18
18 -
 19
19 -
 20
20 -
 21
21 -
 22
22 -
 23
23 -
 24
24 -
 25
25 -
 26
26 -
 27
27 -
 28
28 -
 29
29 -
 30
30 -
 31
31 -
 32
32 -
 33
33 -
 34
34 -
 35
35 -
36
-
37
-
38
-
39
-
40
-
41
-
42
-
43
-
44
-
45
-
46
-
47
-
48
-
49
-
50
-
51
-
52
-
53
-
54
-
55
-
56
-
57
-
58
-
59
-
60
-
61
-
62
-
63
-
64
-
65
-
66
-
67
-
68
-
69
-
70
-
71
-
72
-
73
-
74
-
75
-
76
-
77
-
78
-
79
-
80
-
81
-
82
-
83
-
84
-
85
-
86
-
87
-
88
-
89
-
90
-
91
-
92
-
93
-
94
-
95
-
96
-
97
-
98
-
99
-
100
-
101
-
102
-
103
-
104
-
105
-
106
-
107
-
108
-
109
-
110
-
111
-
112
-
113
-
114
-
115
-
116
 |
 |

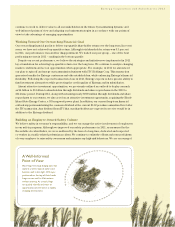
over the same period. In addition New York would experience approximately a 15 percent increase in
carbon emissions under most conventional replacement scenarios, with roughly a 7 percent to 8 percent
increase in nitrogen oxide emissions; and the reliability of the city’s electrical system would be
compromised without the addition of generation and/or transmission facilities.
EWC launched in 2011 a public education campaign to communicate the importance of Indian Point
to the local economy and plans to ramp up these efforts in 2012. Research commissioned by EWC
reveals that slightly less than one-third of New Yorkers surveyed do not support nuclear power or
license renewal of Indian Point – returning to previous levels after a brief increase in the immediate
aftermath of the nuclear events in Japan.
We continue to vigorously address each issue raised in the license renewal process at Pilgrim,
Vermont Yankee and Indian Point. We’re confident that ultimately state and federal decision makers
will recognize the importance of these safe, secure and vital assets to the economic and environmental
quality of life in the communities they serve and make their decisions based on science and fact rather
than emotion and politics.
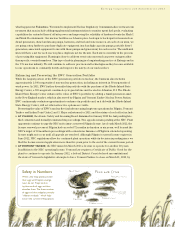
Maintaining a POV-Driven Hedging Strategy
An abundance of shale gas production continues to weigh on prices in the Northeast forward power
market where natural-gas generators are the predominant marginal power price-setters. Since the second
half of 2011, economic concerns and the shale gas effect drove forward prices down significantly. From
our point of view, margin pressures in shale gas production, particularly in dry gas plays, combined with
higher environmental restrictions and increased demand are expected to drive the price of natural gas and
thereby power prices up over the long term. We expect longer-term heat rate and power price expansion
to be driven by shrinking reserve margins from normal load growth as well as older, more polluting units
retiring due to cost pressures and upcoming environmental regulations. Accordingly, our hedging strategy
includes a near-term majority sold position and a longer-term open position, which offers an option on a
price rebound. At the end of 2011, 90 percent of our planned nuclear capacity and energy revenue for 2012
was under contract, 80 percent for 2013 and 43 percent for 2014 at average revenue under contract per
megawatt-hour of $51, $47 and $51, respectively. We continue to monitor the markets and trends affecting
power prices and adjust our point of view and hedging strategies as appropriate.
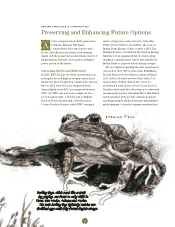
Preserving Value
Given the outlook for forward power prices, we expect EWC’s adjusted earnings before interest,
taxes, depreciation and amortization through 2014 to be below the 2010 level. However, we believe
our non-utility generation business represents a valuable option for economic recovery, more
restrictive environmental regulations and increasing power prices. We are focused on preserving and
enhancing the option value for our shareholders and the communities that EWC serves.
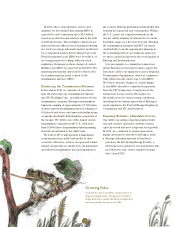
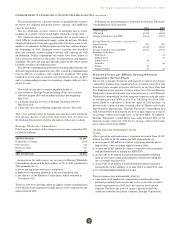
Increasing Net Generation
With a focus on operational excellence, EWC
has improved its nuclear fleet capacity factor
and added capacity through productive uprate
investments. In 2011, EWC recorded its
second highest annual net generation
ever for its nuclear fleet.
50
40
30
20
10
0
EWC Nuclear Generation
January 1999 – December 2011, TWh Illustrative
99 00 01 02 03 04 05 06 07 08 09 10 11
1 Assumes pre-ETR ownership average capacity factor of 75 percent
Capacity Factor Improvements
@ Pre-ETR Ownership Avg. Capacity Factor1Uprates
Entergy Corporation and Subsidiaries 2011
23