Entergy 2011 Annual Report Download - page 60
Download and view the complete annual report
Please find page 60 of the 2011 Entergy annual report below. You can navigate through the pages in the report by either clicking on the pages listed below, or by using the keyword search tool below to find specific information within the annual report.-
 1
1 -
2
-
3
-
4
-
5
-
6
-
7
-
8
-
9
-
10
-
11
-
12
-
13
-
14
-
15
-
16
-
17
-
18
-
19
-
20
-
21
-
22
-
23
-
24
-
25
-
26
-
27
-
28
-
29
-
30
-
31
-
32
-
33
-
34
-
35
-
36
-
37
-
38
-
39
-
40
-
41
-
42
-
43
-
44
-
45
-
46
-
47
-
48
-
49
-
 50
50 -
 51
51 -
 52
52 -
 53
53 -
 54
54 -
 55
55 -
 56
56 -
 57
57 -
 58
58 -
 59
59 -
 60
60 -
 61
61 -
 62
62 -
 63
63 -
 64
64 -
 65
65 -
 66
66 -
 67
67 -
 68
68 -
 69
69 -
 70
70 -
71
-
72
-
73
-
74
-
75
-
76
-
77
-
78
-
79
-
80
-
81
-
82
-
83
-
84
-
85
-
86
-
87
-
88
-
89
-
90
-
91
-
92
-
93
-
94
-
95
-
96
-
97
-
98
-
99
-
100
-
101
-
102
-
103
-
104
-
105
-
106
-
107
-
108
-
109
-
110
-
111
-
112
-
113
-
114
-
115
-
116
 |
 |

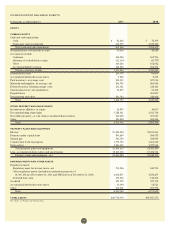
In thousands, as of December 31, 2011 2010
ASSETS
CURRENT ASSETS
Cash and cash equivalents:
Cash $ 81,468 $ 76,290
Temporary cash investments 612,970 1,218,182
Total cash and cash equivalents 694,438 1,294,472
Securitization recovery trust account 50,304 43,044
Accounts receivable:
Customer 568,558 602,796
Allowance for doubtful accounts (31,159) (31,777)
Other 166,186 161,662
Accrued unbilled revenues 298,283 302,901
Total accounts receivable 1,001,868 1,035,582
Deferred fuel costs 209,776 64,659
Accumulated deferred income taxes 9,856 8,472
Fuel inventory - at average cost 202,132 207,520
Materials and supplies - at average cost 894,756 866,908
Deferred nuclear refueling outage costs 231,031 218,423
System agreement cost equalization 36,800 52,160
Prepaid taxes – 301,807
Prepayments and other 291,742 246,036
Total 3,622,703 4,339,083
OTHER PROPERTY AND INVESTMENTS
Investment in affiliates - at equity 44,876 40,697
Decommissioning trust funds 3,788,031 3,595,716
Non-utility property - at cost (less accumulated depreciation) 260,436 257,847
Other 416,423 405,946
Total 4,509,766 4,300,206
PROPERTY, PLANT AND EQUIPMENT
Electric 39,385,524 37,153,061
Property under capital lease 809,449 800,078
Natural gas 343,550 330,608
Construction work in progress 1,779,723 1,661,560
Nuclear fuel 1,546,167 1,377,962
Total property, plant and equipment 43,864,413 41,323,269
Less - accumulated depreciation and amortization 18,255,128 17,474,914
Property, plant and equipment - net 25,609,285 23,848,355
DEFERRED DEBITS AND OTHER ASSETS
Regulatory assets:
Regulatory asset for income taxes - net 799,006 845,725
Other regulatory assets (includes securitization property of
$1,009,103 as of December 31, 2011 and $882,346 as of December 31, 2010) 4,636,871 3,838,237
Deferred fuel costs 172,202 172,202
Goodwill 377,172 377,172
Accumulated deferred income taxes 19,003 54,523
Other 955,691 909,773
Total 6,959,945 6,197,632
TOTAL ASSETS $40,701,699 $38,685,276
See Notes to Financial Statements.
CONSOLIDATED BALANCE SHEETS
58