Entergy 2011 Annual Report Download - page 34
Download and view the complete annual report
Please find page 34 of the 2011 Entergy annual report below. You can navigate through the pages in the report by either clicking on the pages listed below, or by using the keyword search tool below to find specific information within the annual report.-
 1
1 -
2
-
3
-
4
-
5
-
6
-
7
-
8
-
9
-
10
-
11
-
12
-
13
-
14
-
15
-
16
-
17
-
18
-
19
-
20
-
21
-
22
-
23
-
 24
24 -
 25
25 -
 26
26 -
 27
27 -
 28
28 -
 29
29 -
 30
30 -
 31
31 -
 32
32 -
 33
33 -
 34
34 -
 35
35 -
 36
36 -
 37
37 -
 38
38 -
 39
39 -
 40
40 -
 41
41 -
 42
42 -
 43
43 -
 44
44 -
45
-
46
-
47
-
48
-
49
-
50
-
51
-
52
-
53
-
54
-
55
-
56
-
57
-
58
-
59
-
60
-
61
-
62
-
63
-
64
-
65
-
66
-
67
-
68
-
69
-
70
-
71
-
72
-
73
-
74
-
75
-
76
-
77
-
78
-
79
-
80
-
81
-
82
-
83
-
84
-
85
-
86
-
87
-
88
-
89
-
90
-
91
-
92
-
93
-
94
-
95
-
96
-
97
-
98
-
99
-
100
-
101
-
102
-
103
-
104
-
105
-
106
-
107
-
108
-
109
-
110
-
111
-
112
-
113
-
114
-
115
-
116
 |
 |

MANAGEMENT’S FINANCIAL DISCUSSION AND ANALYSIS
Entergy operates primarily through two business segments: Utility
and Entergy Wholesale Commodities.
n The UTILITY business segment includes the generation,
transmission, distribution, and sale of electric power in portions
of Arkansas, Mississippi, Texas, and Louisiana, including the City
of New Orleans; and operates a small natural gas distribution
business. As discussed in more detail in “Plan to Spin Off the
Utility’s Transmission Business,” in December 2011, Entergy
entered into an agreement to spin off its transmission business and
merge it with a newly-formed subsidiary of ITC Holdings Corp.
n The ENTERGY WHOLESALE COMMODITIES business segment
includes the ownership and operation of six nuclear power plants
located in the northern United States and the sale of the electric
power produced by those plants to wholesale customers. This
business also provides services to other nuclear power plant
owners. Entergy Wholesale Commodities also owns interests in
non-nuclear power plants that sell the electric power produced by
those plants to wholesale customers.
Following are the percentages of Entergy’s consolidated revenues
and net income generated by its operating segments and the
percentage of total assets held by them:
% of Revenue
Segment 2011 2010 2009
Utility 79 78 75
Entergy Wholesale Commodities 21 22 25
Parent & Other – – –
% of Net Income
Segment 2011 2010 2009
Utility 82 65 57
Entergy Wholesale Commodities 36 39 51
Parent & Other (18) (4) (8)
% of Total Assets
Segment 2011 2010 2009
Utility 80 80 80
Entergy Wholesale Commodities 26 26 30
Parent & Other (6) (6) (10)
RESULTS OF OPERATIONS
2011 Compared to 2010
Following are income statement variances for Utility, Entergy
Wholesale Commodities, Parent & Other, and Entergy comparing 2011
to 2010 showing how much the line item increased or (decreased)
in comparison to the prior period (in thousands):
Entergy
Wholesale Parent
Utility Commodities & Other Entergy
2010 Consolidated
Net Income (Loss) $ 829,719 $489,422 $ (48,836) $1,270,305
Net revenue (operating
revenue less fuel expense,
purchased power, and
other regulatory
charges/credits) (146,947) (155,898) 3,620 (299,225)
Other operation and
maintenance expenses 1,674 (141,588) 38,270 (101,644)
Taxes other than
income taxes 248 1,083 396 1,727
Depreciation and
amortization 16,326 16,008 (26) 32,308
Gain on sale of business – (44,173) – (44,173)
Other income (3,388) (39,717) 1,799 (41,306)
Interest expense (37,502) (51,183) 27,145 (61,540)
Other 1,688 (23,334) – (21,646)
Income taxes (benefit) (426,916) (43,193) 139,133 (330,976)
2011 Consolidated
Net Income (Loss) $1,123,866 $491,841 $(248,335) $1,367,372
Refer to “Selected Financial Data - Five-Year Comparison Of
Entergy Corporation And Subsidiaries” which accompanies Entergy
Corporation’s financial statements in this report for further information
with respect to operating statistics.
Net income for Utility in 2011 was significantly affected by a
settlement with the IRS related to the mark-to-market income tax
treatment of power purchase contracts, which resulted in a reduction
in income tax expense. The net income effect was partially offset by
a regulatory charge, which reduced net revenue, because a portion
of the benefits will be shared with customers. See Notes 3 and 8 to
the financial statements for additional discussion of the settlement
and benefit sharing.
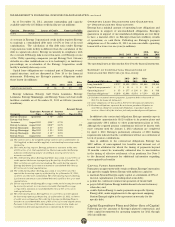
NET RE V E N U E
Utility
Following is an analysis of the change in net revenue, comparing
2011 to 2010 (in millions):
2010 Net Revenue $5,051
Mark-to-market tax settlement sharing (196)
Purchased power capacity (21)
Net wholesale revenue (14)
Volume/weather 13
ANO decommissioning trust 24
Retail electric price 49
Other (2)
2011 Net Revenue $4,904
The mark-to-market tax settlement sharing variance results from
a regulatory charge because a portion of the benefits of a settlement
with the IRS related to the mark-to-market income tax treatment of
power purchase contracts will be shared with customers, slightly
offset by the amortization of a portion of that charge beginning
in October 2011. See Notes 3 and 8 to the financial statements for
additional discussion of the settlement and benefit sharing.
32