Entergy 2011 Annual Report Download - page 101
Download and view the complete annual report
Please find page 101 of the 2011 Entergy annual report below. You can navigate through the pages in the report by either clicking on the pages listed below, or by using the keyword search tool below to find specific information within the annual report.-
 1
1 -
2
-
3
-
4
-
5
-
6
-
7
-
8
-
9
-
10
-
11
-
12
-
13
-
14
-
15
-
16
-
17
-
18
-
19
-
20
-
21
-
22
-
23
-
24
-
25
-
26
-
27
-
28
-
29
-
30
-
31
-
32
-
33
-
34
-
35
-
36
-
37
-
38
-
39
-
40
-
41
-
42
-
43
-
44
-
45
-
46
-
47
-
48
-
49
-
50
-
51
-
52
-
53
-
54
-
55
-
56
-
57
-
58
-
59
-
60
-
61
-
62
-
63
-
64
-
65
-
66
-
67
-
68
-
69
-
70
-
71
-
72
-
73
-
74
-
75
-
76
-
77
-
78
-
79
-
80
-
81
-
82
-
83
-
84
-
85
-
86
-
87
-
88
-
89
-
90
-
 91
91 -
 92
92 -
 93
93 -
 94
94 -
 95
95 -
 96
96 -
 97
97 -
 98
98 -
 99
99 -
 100
100 -
 101
101 -
 102
102 -
 103
103 -
 104
104 -
 105
105 -
 106
106 -
 107
107 -
 108
108 -
 109
109 -
 110
110 -
 111
111 -
112
-
113
-
114
-
115
-
116
 |
 |
Entergy Corporation and Subsidiaries 2011
option grants. The 2011 Plan, which only applies to awards made on or
after May 6, 2011, will expire after 10 years. As of December 31, 2011,
there were 5,495,276 authorized shares remaining for stock-based
awards, including 2,000,000 for incentive stock option grants.
Stock Options
Stock options are granted at exercise prices that equal the closing
market price of Entergy Corporation common stock on the date of
grant. Generally, stock options granted will become exercisable in
equal amounts on each of the first three anniversaries of the date
of grant. Unless they are forfeited previously under the terms of the
grant, options expire ten years after the date of the grant if they are
not exercised.
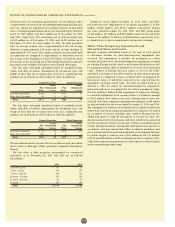
The following table includes financial information for stock
options for each of the years presented (in millions):
2011 2010 2009
Compensation expense included in
Entergy’s consolidated net income $10.4 $15.0 $16.8
Tax benefit recognized in Entergy’s
consolidated net income $ 4.0 $ 5.8 $ 6.5
Compensation cost capitalized as
part of fixed assets and inventory $ 2.0 $ 2.9 $ 3.2
Entergy determines the fair value of the stock option grants
by considering factors such as lack of marketability, stock
retention requirements, and regulatory restrictions on exercisability
in accordance with accounting standards. The stock option
weighted-average assumptions used in determining the fair values
are as follows:
2011 2010 2009
Stock price volatility 24.25% 25.73% 24.39%
Expected term in years 6.64% 5.46 5.33
Risk-free interest rate 2.70% 2.57% 2.22%
Dividend yield 4.20% 3.74% 3.50%
Dividend payment per share $3.32 $3.24 $3.00
Stock price volatility is calculated based upon the weekly public
stock price volatility of Entergy Corporation common stock over the
last four to five years. The expected term of the options is based
upon historical option exercises and the weighted average life of
options when exercised and the estimated weighted average life of
all vested but unexercised options. In 2008, Entergy implemented
stock ownership guidelines for its senior executive officers. These
guidelines require an executive officer to own shares of Entergy
common stock equal to a specified multiple of his or her salary. Until
an executive officer achieves this ownership position the executive
officer is required to retain 75% of the after-tax net profit upon
exercise of the option to be held in Entergy Corporation common
stock. The reduction in fair value of the stock options due to this
restriction is based upon an estimate of the call option value of the
reinvested gain discounted to present value over the applicable
reinvestment period.
NOTES TO CONSOLIDATED FINANCIAL STATEMENTS continued
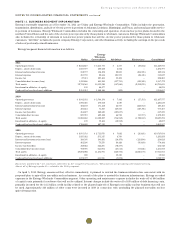
A summary of stock option activity for the year ended December 31, 2011 and changes during the year are presented below:
The weighted-average grant-date fair value of options granted during the year was $13.18 for 2010 and $12.47 for 2009. The total intrinsic value
of stock options exercised was $29.6 million during 2011, $36.6 million during 2010, and $35.6 million during 2009. The intrinsic value, which
has no effect on net income, of the stock options exercised is calculated by the difference in Entergy Corporation’s common stock price on
the date of exercise and the exercise price of the stock options granted. Because Entergy’s year-end stock price is less than the weighted
average exercise price, the aggregate intrinsic value of outstanding stock options as of December 31, 2011 was zero. The intrinsic value of “in
the money” stock options is $67 million as of December 31, 2011. Entergy recognizes compensation cost over the vesting period of the options
based on their grant-date fair value. The total fair value of options that vested was approximately $16 million during 2011, $21 million during
2010, and $22 million during 2009.
Options outstanding as of January 1, 2011
Options granted
Options exercised
Options forfeited/expired
Options outstanding as of December 31, 2011
Options exercisable as of December 31, 2011
Weighted-average grant-date fair value of options granted during 2011
Weighted-Average Aggregate Weighted-Average
Number of Options Exercise Price Intrinsic Value Contractual Life
11,225,725 $72.45
388,200 $72.79
(1,079,008) $42.43
(75,499) $86.62
10,459,418 $75.46 $ – 4.7 years
9,011,257 $75.36 $ – 4.1 years
$11.48
99