Entergy 2011 Annual Report Download - page 54
Download and view the complete annual report
Please find page 54 of the 2011 Entergy annual report below. You can navigate through the pages in the report by either clicking on the pages listed below, or by using the keyword search tool below to find specific information within the annual report.-
 1
1 -
2
-
3
-
4
-
5
-
6
-
7
-
8
-
9
-
10
-
11
-
12
-
13
-
14
-
15
-
16
-
17
-
18
-
19
-
20
-
21
-
22
-
23
-
24
-
25
-
26
-
27
-
28
-
29
-
30
-
31
-
32
-
33
-
34
-
35
-
36
-
37
-
38
-
39
-
40
-
41
-
42
-
43
-
 44
44 -
 45
45 -
 46
46 -
 47
47 -
 48
48 -
 49
49 -
 50
50 -
 51
51 -
 52
52 -
 53
53 -
 54
54 -
 55
55 -
 56
56 -
 57
57 -
 58
58 -
 59
59 -
 60
60 -
 61
61 -
 62
62 -
 63
63 -
 64
64 -
65
-
66
-
67
-
68
-
69
-
70
-
71
-
72
-
73
-
74
-
75
-
76
-
77
-
78
-
79
-
80
-
81
-
82
-
83
-
84
-
85
-
86
-
87
-
88
-
89
-
90
-
91
-
92
-
93
-
94
-
95
-
96
-
97
-
98
-
99
-
100
-
101
-
102
-
103
-
104
-
105
-
106
-
107
-
108
-
109
-
110
-
111
-
112
-
113
-
114
-
115
-
116
 |
 |

MANAGEMENT’S FINANCIAL DISCUSSION AND ANALYSIS continued
a range of 5.1% to 5.2% in 2011. The discount rate used to calculate
its other postretirement benefit obligation also decreased from 5.5%
in 2010 to 5.1% in 2011.
Entergy reviews actual recent cost trends and projected future
trends in establishing health care cost trend rates. Based on this
review, Entergy’s assumed health care cost trend rate assumption
used in measuring the December 31, 2011 accumulated postretirement
benefit obligation and 2012 postretirement cost was 7.75% for pre-65
retirees and 7.5% for post-65 retirees for 2012, gradually decreasing
each successive year until it reaches 4.75% in 2022 and beyond for
both pre-65 and post-65 retirees. Entergy’s health care cost trend rate
assumption used in measuring the December 31, 2010 accumulated
postretirement benefit obligation and 2011 postretirement cost
was 8.5% for pre-65 retirees and 8.0% for post-65 retirees for 2011,
gradually decreasing each successive year, until it reaches a 4.75%
annual increase in health care costs in 2019 for pre-65 retirees and
4.75% in 2018 and beyond for post-65 retirees.
The assumed rate of increase in future compensation levels used
to calculate 2011 and 2010 benefit obligations was 4.23%.
In determining its expected long-term rate of return on plan
assets used in the calculation of benefit plan costs, Entergy reviews
past performance, current and expected future asset allocations,
and capital market assumptions of its investment consultant and
investment managers.
Since 2003, Entergy has targeted an asset allocation for its qualified
pension plan assets of roughly 65% equity securities and 35% fixed-
income securities. Entergy completed and adopted an optimization
study in 2011 for the pension assets which recommended that the
target asset allocation adjust dynamically over time, based on the
funded status of the plan, from its current to its ultimate allocation
of 45% equity, 55% fixed income. The ultimate asset allocation is
expected to be attained when the plan is 105% funded.
The current target allocations for Entergy’s non-taxable
postretirement benefit assets are 55% equity securities and 45%
fixed-income securities and, for its taxable other postretirement
benefit assets, 35% equity securities and 65% fixed-income securities.
Entergy also completed and adopted an optimization study in
2011 for the postretirement benefit trust assets that recommends
both the taxable and the non-taxable assets move to 65% equity
securities and 35% fixed-income securities. Entergy plans to adjust
the postretirement asset allocation during 2012.
Entergy’s expected long term rate of return on qualified pension
assets used to calculate 2011, 2010 and 2009 qualified pension costs
was 8.5% and will be 8.5% for 2012. Entergy’s expected long term
rate of return on non-taxable other postretirement assets used to
calculate other postretirement costs was 7.75% for 2011 and 2010,
8.5% for 2009 and will be 8.5% for 2012. For Entergy’s taxable
postretirement assets, the expected long term rate of return was
5.5% for 2011 and 2010, 6% for 2009 and will be 6.5% in 2012.
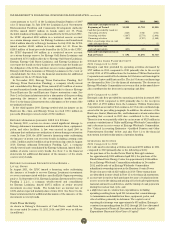
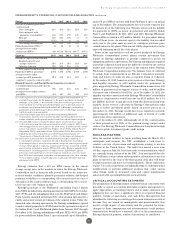
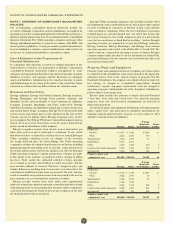
COST SE N SI TI VI T Y
The following chart reflects the sensitivity of qualified pension cost
and qualified pension projected benefit obligation to changes in
certain actuarial assumptions (dollars in thousands):
Impact on
Qualified
Impact on 2011 Projected
Change in Qualified Benefit
Actuarial Assumption Assumption Pension Cost Obligation
Increase/(Decrease)
Discount rate (0.25%) $17,145 $188,246
Rate of return on plan assets (0.25%) $ 8,863 $ –
Rate of increase in
compensation 0.25% $ 7,503 $ 41,227
The following chart reflects the sensitivity of postretirement benefit
cost and accumulated postretirement benefit obligation to changes in
certain actuarial assumptions (dollars in thousands):
Impact on
Accumulated
Impact on 2011 Postretirement
Change in Postretirement Benefit
Actuarial Assumption Assumption Benefit Cost Obligation
Increase/(Decrease)
Health care cost trend 0.25% $8,900 $52,730
Discount rate (0.25%) $6,622 $62,316
Each fluctuation above assumes that the other components of the
calculation are held constant.
ACC OUNTING MECHAN I S M S
Accounting standards require an employer to recognize in its
balance sheet the funded status of its benefit plans. Refer to Note
11 to the financial statements for a further discussion of Entergy’s
funded status.
In accordance with pension accounting standards, Entergy utilizes
a number of accounting mechanisms that reduce the volatility of
reported pension costs. Differences between actuarial assumptions
and actual plan results are deferred and are amortized into expense
only when the accumulated differences exceed 10% of the greater
of the projected benefit obligation or the market-related value of
plan assets. If necessary, the excess is amortized over the average
remaining service period of active employees.
Entergy calculates the expected return on pension and other
postretirement benefit plan assets by multiplying the long-term
expected rate of return on assets by the market-related value (MRV)
of plan assets. Entergy determines the MRV of pension plan assets by
calculating a value that uses a 20-quarter phase-in of the difference
between actual and expected returns. For other postretirement
benefit plan assets Entergy uses fair value when determining MRV.
COST S A N D FU N D I N G
In 2011, Entergy’s total qualified pension cost was $154 million.
Entergy anticipates 2012 qualified pension cost to be $264 million.
Pension funding was approximately $400 million for 2011. Entergy’s
contributions to the pension trust are currently estimated to be
approximately $163 million in 2012, although the required pension
contributions will not be known with more certainty until the January
1, 2012 valuations are completed by April 1, 2012. Entergy’s preliminary
estimates of 2012 funding requirements indicate that the contributions
will not exceed historical levels of pension contributions.
Minimum required funding calculations as determined under
Pension Protection Act guidance are performed annually as of
January 1 of each year and are based on measurements of the assets
and funding liabilities as measured at that date. Any excess of the
funding liability over the calculated fair market value of assets results
in a funding shortfall which, under the Pension Protection Act, must
be funded over a seven-year rolling period. The Pension Protection
Act also imposes certain plan limitations if the funded percentage,
which is based on a calculated fair market values of assets divided
by funding liabilities, does not meet certain thresholds. For funding
purposes, asset gains and losses are smoothed in to the calculated
fair market value of assets and the funding liability is based upon a
weighted average 24-month corporate bond rate published by the U.S.
Treasury; therefore, periodic changes in asset returns and interest
rates can affect funding shortfalls and future cash contributions.
Total postretirement health care and life insurance benefit
costs for Entergy in 2011 were $114.7 million, including $33
million in savings due to the estimated effect of future Medicare
Part D subsidies. Entergy expects 2012 postretirement health
care and life insurance benefit costs to be $138.4 million.
This includes a projected $31.2 million in savings due to the
estimated effect of future Medicare Part D subsidies. Entergy
52