Entergy 2011 Annual Report Download - page 38
Download and view the complete annual report
Please find page 38 of the 2011 Entergy annual report below. You can navigate through the pages in the report by either clicking on the pages listed below, or by using the keyword search tool below to find specific information within the annual report.-
 1
1 -
2
-
3
-
4
-
5
-
6
-
7
-
8
-
9
-
10
-
11
-
12
-
13
-
14
-
15
-
16
-
17
-
18
-
19
-
20
-
21
-
22
-
23
-
24
-
25
-
26
-
27
-
 28
28 -
 29
29 -
 30
30 -
 31
31 -
 32
32 -
 33
33 -
 34
34 -
 35
35 -
 36
36 -
 37
37 -
 38
38 -
 39
39 -
 40
40 -
 41
41 -
 42
42 -
 43
43 -
 44
44 -
 45
45 -
 46
46 -
 47
47 -
 48
48 -
49
-
50
-
51
-
52
-
53
-
54
-
55
-
56
-
57
-
58
-
59
-
60
-
61
-
62
-
63
-
64
-
65
-
66
-
67
-
68
-
69
-
70
-
71
-
72
-
73
-
74
-
75
-
76
-
77
-
78
-
79
-
80
-
81
-
82
-
83
-
84
-
85
-
86
-
87
-
88
-
89
-
90
-
91
-
92
-
93
-
94
-
95
-
96
-
97
-
98
-
99
-
100
-
101
-
102
-
103
-
104
-
105
-
106
-
107
-
108
-
109
-
110
-
111
-
112
-
113
-
114
-
115
-
116
 |
 |

MANAGEMENT’S FINANCIAL DISCUSSION AND ANALYSIS continued
As shown in the table above, net revenue for Entergy Wholesale
Commodities decreased by $164 million, or 7%, in 2010 compared
to 2009 primarily due to results from its nuclear operations. The net
revenue decrease was primarily due to lower pricing in its contracts
to sell nuclear power and lower nuclear volume resulting from more
planned and unplanned outage days in 2010. Included in net revenue
is $46 million and $53 million of amortization of the Palisades
purchased power agreement in 2010 and 2009, respectively, which
is non-cash revenue and is discussed in Note 15 to the financial
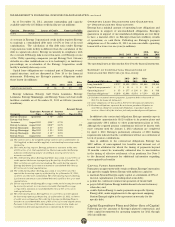
statements. Following are key performance measures for Entergy
Wholesale Commodities’ nuclear plants for 2010 and 2009:
2010 2009
Net MW in operation at December 31 4,998 4,998
Average realized revenue per MWh $59.16 $61.07
GWh billed 39,655 40,981
Capacity factor 90% 93%
Refueling outage days:
FitzPatrick 35 –
Indian Point 2 33 –
Indian Point 3 – 36
Palisades 26 41
Pilgrim – 31
Vermont Yankee 29 –
Overall, including its non-nuclear plants, Entergy Wholesale
Commodities billed 42,682 GWh in 2010 and 43,969 GWh in 2009,
with average realized revenue per MWh of $59.04 in 2010 and $60.46
in 2009.
OTH E R INCO M E STATE M E NT ITE M S
Utility
Other operation and maintenance expenses increased from $1,837
million for 2009 to $1,949 million for 2010 primarily due to:
n an increase of $70 million in compensation and benefits costs,
resulting from decreasing discount rates, the amortization
of benefit trust asset losses, and an increase in the accrual
for incentive-based compensation. See “Critical Accounting
Estimates - Qualified Pension and Other Postretirement Benefits”
below and also Note 11 to the financial statements for further
discussion of benefits costs;
n an increase of $25 million in fossil-fueled generation expenses
resulting from higher outage costs in 2010 primarily because the
scope of the outages was greater than in 2009;
n an increase of $17 million in transmission and distribution
expenses resulting from increased vegetation contract work;
n an increase of $13 million in nuclear expenses primarily due to
higher nuclear labor and contract costs;
n an increase of $12.5 million due to the capitalization in 2009 of
Ouachita Plant service charges previously expensed; and
n an increase of $11 million due to the amortization of Entergy
Texas rate case expenses. See Note 2 to the financial statements
for further discussion of the Entergy Texas rate case settlement.
The increase was partially offset by:
n a decrease of $19.4 million due to 2008 storm costs at Entergy
Arkansas which were deferred per an APSC order and were
recovered through revenues in 2009;
n a decrease of $16 million due to higher write-offs of uncollectible
customer accounts in 2009; and
n charges of $14 million in 2009 due to the Hurricane Ike and
Hurricane Gustav storm cost recovery settlement agreement, as
discussed further in Note 2 to the financial statements.
Other income decreased primarily due to:
n a decrease of $50 million in carrying charges on storm
restoration costs because of the completion of financing or
securitization of the costs, as discussed further in Note 2 to the
financial statements; and
n a gain of $16 million recorded in 2009 on the sale of undeveloped
real estate by Entergy Louisiana Properties, LLC.
The decrease was partially offset by:
n an increase of $24 million due to investment gains from the
ANO 1 and 2 decommissioning trust, as discussed above;
n an increase of $14 million resulting from higher earnings on
decommissioning trust funds; and
n an increase of distributions of $13 million earned by Entergy
Louisiana and $7 million earned by Entergy Gulf States Louisiana
on investments in preferred membership interests of Entergy
Holdings Company. The distributions on preferred membership
interests are eliminated in consolidation and have no effect
on net income because the investment is in another Entergy
subsidiary. See Note 2 to the financial statements for discussion
of these investments in preferred membership interests.
Interest expense increased primarily due to an increase in long-
term debt outstanding resulting from net debt issuances by certain
of the Utility operating companies in the second half of 2009 and in
2010. See Notes 4 and 5 to the financial statements for details of long-
term debt outstanding.
Depreciation and amortization expenses decreased primarily due
to a decrease in depreciation rates at Entergy Arkansas as a result
of the rate case settlement agreement approved by the APSC in
June 2010.
Entergy Wholesale Commodities
Other operation and maintenance expenses increased from
$922 million for 2009 to $1,047 million for 2010 primarily due to:
n the write-off of $64 million of capital costs, primarily for software
that will not be utilized, and $16 million of additional costs
incurred in connection with Entergy’s decision to unwind the
infrastructure created for the planned spin-off of its non-utility
nuclear business;
n an increase of $36 million in compensation and benefits costs,
resulting from decreasing discount rates, the amortization
of benefit trust asset losses, and an increase in the accrual
for incentive-based compensation. See “Critical Accounting
Estimates - Qualified Pension and Other Postretirement Benefits”
below and also Note 11 to the financial statements for further
discussion of benefits costs;
n spending of $15 million related to tritium remediation work at the
Vermont Yankee site; and
n the write-off of $10 million of capitalized engineering costs
associated with a potential uprate project.
The gain on sale resulted from the sale of Entergy’s ownership
interest in the Harrison County Power Project 550 MW combined-
cycle plant to two Texas electric cooperatives that owned a minority
share of the plant. Entergy sold its 61 percent share of the plant for
$219 million and realized a pre-tax gain of $44.2 million on the sale.
Other income increased primarily due to $86 million in charges
in 2009 resulting from the recognition of impairments that are not
considered temporary of certain equity securities held in Entergy
Wholesale Commodities’ decommissioning trust funds, partially
offset by a decrease of $28 million in realized earnings on the
decommissioning trust funds.
36