Entergy 2003 Annual Report Download - page 85
Download and view the complete annual report
Please find page 85 of the 2003 Entergy annual report below. You can navigate through the pages in the report by either clicking on the pages listed below, or by using the keyword search tool below to find specific information within the annual report.-
 1
1 -
2
-
3
-
4
-
5
-
6
-
7
-
8
-
9
-
10
-
11
-
12
-
13
-
14
-
15
-
16
-
17
-
18
-
19
-
20
-
21
-
22
-
23
-
24
-
25
-
26
-
27
-
28
-
29
-
30
-
31
-
32
-
33
-
34
-
35
-
36
-
37
-
38
-
39
-
40
-
41
-
42
-
43
-
44
-
45
-
46
-
47
-
48
-
49
-
50
-
51
-
52
-
53
-
54
-
55
-
56
-
57
-
58
-
59
-
60
-
61
-
62
-
63
-
64
-
65
-
66
-
67
-
68
-
69
-
70
-
71
-
72
-
73
-
74
-
 75
75 -
 76
76 -
 77
77 -
 78
78 -
 79
79 -
 80
80 -
 81
81 -
 82
82 -
 83
83 -
 84
84 -
 85
85 -
 86
86 -
 87
87 -
 88
88 -
 89
89 -
 90
90 -
 91
91 -
 92
92
 |
 |

83
ENTERGY CORPORATION AND SUBSIDIARIES 2003
NOTE 12. BUSINESS SEGMENT INFORMATION
Entergy’s reportable segments as of December 31, 2003 are
U.S. Utility, Non-Utility Nuclear, and Energy Commodity
Services. U.S. Utility generates, transmits, distributes, and
sells electric power in portions of Arkansas, Louisiana,
Mississippi, and Texas, and provides natural gas utility
service in portions of Louisiana. Non-Utility Nuclear owns
and operates five nuclear power plants and is primarily
focused on selling electric power produced by those plants
to wholesale customers. Energy Commodity Services is
focused primarily on providing energy commodity trading
and gas transportation and storage services through
Entergy-Koch, LP. Energy Commodity Services also
includes non-nuclear wholesale assets, a participant in the
wholesale power generation business in North America and
Europe. Results from Entergy-Koch are reported as equity
in earnings of unconsolidated equity affiliates in the finan-
cial statements. Entergy’s operating segments are strategic
business units managed separately due to their different
operating and regulatory environments. Entergy’s chief
operating decision maker is its Office of the Chief
Executive, which consists of its highest-ranking officers.
“All Other” includes the parent company, Entergy
Corporation, and other business activity, including earnings
on the proceeds of sales of previously owned businesses.
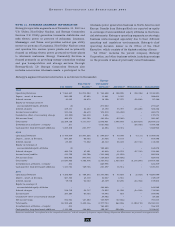
Energy
Non-Utility Commodity
U.S. Utility Nuclear* Services* All Other* Eliminations Consolidated
2003
Operating Revenues $ 7,584,857 $1,274,983 $ 184,888 $ 188,228 $ (38,036) $ 9,194,920
Deprec., amort. & decomm. 890,092 87,825 13,681 5,005 – 996,603
Interest income 43,035 36,874 18,128 27,575 (38,226) 87,386
Equity in earnings (loss) of
unconsolidated equity affiliates (3) – 271,650 – – 271,647
Interest charges 419,111 34,460 15,193 75,787 (38,225) 506,326
Income taxes (credits) 341,044 88,619 105,903 (45,492) – 490,074
Cumulative effect of accounting change (21,333) 154,512 3,895 – – 137,074
Net income (loss) 492,574 300,799 180,454 (23,360) – 950,467
Total assets 22,429,136 4,171,777 2,076,921 1,495,903 (1,619,527) 28,554,210
Investments in affiliates - at equity 211 – 1,081,462 – (28,345) 1,053,328
Cash paid for long-lived asset additions 1,233,208 281,377 44,284 10,074 – 1,568,943
2002
Operating Revenues $ 6,773,509 $1,200,238 $ 294,670 $ 40,729 $ (4,111) $ 8,305,035
Deprec., amort. & decomm. 800,257 88,733 21,465 5,143 – 915,598
Interest income 23,231 71,262 26,140 35,433 (37,741) 118,325
Equity in earnings of
unconsolidated equity affiliates (2) – 183,880 – – 183,878
Interest charges 465,703 47,291 61,632 35,579 (37,741) 572,464
Income taxes (credits) 313,752 132,726 (141,288) (11,252) – 293,938
Net income (loss) 606,963 200,505 (145,830) (38,566) – 623,072
Total assets 21,630,523 4,482,308 2,167,472 1,327,354 (2,103,291) 27,504,366
Investments in affiliates - at equity 214 – 823,995 – – 824,209
Cash paid for long-lived asset additions 1,131,734 169,756 210,297 18,514 – 1,530,301
2001
Operating Revenues $ 7,432,920 $ 789,244 $1,370,485 $ 34,603 $ (6,353) $ 9,620,899
Deprec., amort. & decomm. 667,333 43,103 34,667 4,516 – 749,619
Interest income 79,702 54,053 23,169 37,235 (34,354) 159,805
Equity in earnings of
unconsolidated equity affiliates – – 162,882 – – 162,882
Interest charges 576,705 55,717 74,953 41,558 (34,353) 714,580
Income taxes 300,284 80,053 74,493 863 – 455,693
Cumulative effect of accounting change – – 23,482 – – 23,482
Net income (loss) 574,554 127,880 105,939 (57,866) – 750,507
Total assets 20,309,695 3,449,156 2,377,733 863,906 (1,090,179) 25,910,311
Investments in affiliates - at equity 214 – 765,889 – – 766,103
Cash paid for long-lived asset additions 1,110,484 126,880 199,387 599,886 – 2,036,637
Businesses marked with * are referred to as the “competitive businesses,” with the exception of the parent company, Entergy Corporation. Eliminations are primarily intersegment activity.
Entergy’s segment financial information is as follows (in thousands):