Entergy 2003 Annual Report Download - page 82
Download and view the complete annual report
Please find page 82 of the 2003 Entergy annual report below. You can navigate through the pages in the report by either clicking on the pages listed below, or by using the keyword search tool below to find specific information within the annual report.-
 1
1 -
2
-
3
-
4
-
5
-
6
-
7
-
8
-
9
-
10
-
11
-
12
-
13
-
14
-
15
-
16
-
17
-
18
-
19
-
20
-
21
-
22
-
23
-
24
-
25
-
26
-
27
-
28
-
29
-
30
-
31
-
32
-
33
-
34
-
35
-
36
-
37
-
38
-
39
-
40
-
41
-
42
-
43
-
44
-
45
-
46
-
47
-
48
-
49
-
50
-
51
-
52
-
53
-
54
-
55
-
56
-
57
-
58
-
59
-
60
-
61
-
62
-
63
-
64
-
65
-
66
-
67
-
68
-
69
-
70
-
71
-
 72
72 -
 73
73 -
 74
74 -
 75
75 -
 76
76 -
 77
77 -
 78
78 -
 79
79 -
 80
80 -
 81
81 -
 82
82 -
 83
83 -
 84
84 -
 85
85 -
 86
86 -
 87
87 -
 88
88 -
 89
89 -
 90
90 -
 91
91 -
 92
92
 |
 |

80
ENTERGY CORPORATION AND SUBSIDIARIES 2003
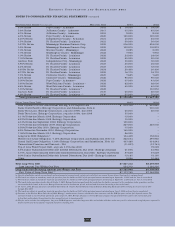
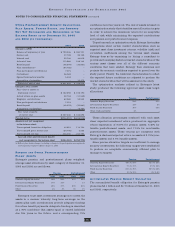
OTHER POSTRETIREMENT BENEFIT OBLIGATIONS,
PLAN ASSETS, FUNDED STATUS, AND AMOUNTS
NOT YET RECOGNIZED AND RECOGNIZED IN THE
BALANCE SHEET AS OF DECEMBER 31, 2003
AND 2002 (IN THOUSANDS):
2003 2002
Change in APBO
Balance at beginning of year $ 799,506 $ 590,731
Service cost 37,799 29,199
Interest cost 52,746 44,819
Actuarial loss 115,966 159,143
Benefits paid (48,379) (35,861)
Plan amendments (a) (84,722) –
Plan participant contributions 7,074 –
Curtailment 56,369 –
Special termination benefits 5,444 –
Acquisition of subsidiary – 11,475
Balance at end of year $ 941,803 $ 799,506
Change in Plan Assets
Fair value of assets at
beginning of year $ 182,692 $ 158,190
Actual return on plan assets 22,794 (11,559)
Employer contributions 63,265 59,542
Plan participant contributions 7,074 –
Benefits paid (48,379) (35,861)
Acquisition of subsidiary – 12,380
Fair value of assets
at end of year $ 227,446 $ 182,692
Funded status $(714,357) $(616,814)
Amounts not yet recognized
in the balance sheet:
Unrecognized transition obligation 44,815 114,724
Unrecognized prior service cost (20,746) 3,522
Unrecognized net loss 336,005 245,795
Accrued other postretirement benefit
cost recognized in the balance sheet $(354,283) $(252,773)
(a) Reflects plan design changes, including a change in the participation assumption for
non-bargaining employees effective August 1, 2003.
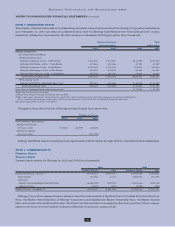
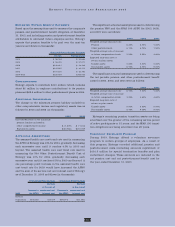
PENSION AND OTHER POSTRETIREMENT
PLANS’ ASSETS
Entergy’s pension and postretirement plans weighted-
average asset allocations by asset category at December 31,
2003 and 2002 are as follows:
Pension Postretirement
2003 2002 2003 2002
Domestic Equity Securities 56% 50% 37% 34%
International Equity Securities 14% 10% – 1%
Fixed Income Securities 28% 37% 60% 64%
Other 2% 3% 3% 1%
Entergy’s trust asset investment strategy is to invest the
assets in a manner whereby long-term earnings on the
assets (plus cash contributions) provide adequate funding
for retiree benefit payments. Adequate funding is described
as a 90% confidence that assets equal or exceed liabilities
due five years in the future, and a corresponding 75%
confidence level ten years out. The mix of assets is based on
an optimization study that identifies asset allocation targets
in order to achieve the maximum return for an acceptable
level of risk while minimizing the expected contributions
and pension and postretirement expense.
To perform such an optimization study, Entergy first makes
assumptions about certain market characteristics, such as
expected asset class investment returns, volatility (risk) and
correlation coefficients among the various asset classes.
Entergy does so by examining (or hiring a consultant to
provide such analysis) historical market characteristics of the
various asset classes over all of the different economic
conditions that have existed. Entergy then examines and
projects the economic conditions expected to prevail over the
study period. Finally, the historical characteristics to reflect
the expected future conditions are adjusted to produce the
market characteristics that will be assumed in the study.
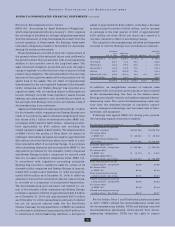
The optimization analysis utilized in Entergy’s latest
study produced the following approved asset class target
allocations.
Pension Postretirement
Domestic Equity Securities 54% 37%
International Equity Securities 12% 8%
Fixed Income Securities 30% 55%
Other (Cash and GACs) 4% –
These allocation percentages combined with each asset
class’ expected investment return produced an aggregate
return expectation of 9.59% for pension assets, 5.45% for
taxable postretirement assets, and 7.19% for non-taxable
postretirement assets. These returns are consistent with
Entergy’s disclosed expected return on assets of 8.75% (non-
taxable assets) and 5.5% (taxable assets).
Since precise allocation targets are inefficient to manage
security investments, the following ranges were established
to produce an acceptable economically efficient plan to
manage to targets:
Pension Postretirement
Domestic Equity Securities 49% to 59% 32% to 42%
International Equity Securities 7% to 17% 3% to 12%
Fixed Income Securities 25% to 35% 50% to 60%
Other 0% to 10% 0% to 5%
ACCUMULATED PENSION BENEFIT OBLIGATION
The accumulated benefit obligation for Entergy’s pension
plans was $2.1 billion and $1.7 billion at December 31, 2003
and 2002, respectively.
NOTES TO CONSOLIDATED FINANCIAL STATEMENTS
continued