Entergy 2003 Annual Report Download - page 53
Download and view the complete annual report
Please find page 53 of the 2003 Entergy annual report below. You can navigate through the pages in the report by either clicking on the pages listed below, or by using the keyword search tool below to find specific information within the annual report.-
 1
1 -
2
-
3
-
4
-
5
-
6
-
7
-
8
-
9
-
10
-
11
-
12
-
13
-
14
-
15
-
16
-
17
-
18
-
19
-
20
-
21
-
22
-
23
-
24
-
25
-
26
-
27
-
28
-
29
-
30
-
31
-
32
-
33
-
34
-
35
-
36
-
37
-
38
-
39
-
40
-
41
-
42
-
 43
43 -
 44
44 -
 45
45 -
 46
46 -
 47
47 -
 48
48 -
 49
49 -
 50
50 -
 51
51 -
 52
52 -
 53
53 -
 54
54 -
 55
55 -
 56
56 -
 57
57 -
 58
58 -
 59
59 -
 60
60 -
 61
61 -
 62
62 -
 63
63 -
64
-
65
-
66
-
67
-
68
-
69
-
70
-
71
-
72
-
73
-
74
-
75
-
76
-
77
-
78
-
79
-
80
-
81
-
82
-
83
-
84
-
85
-
86
-
87
-
88
-
89
-
90
-
91
-
92
 |
 |

51
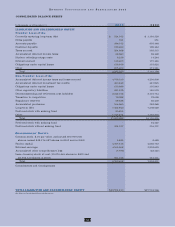
ENTERGY CORPORATION AND SUBSIDIARIES 2003
CONSOLIDATED STATEMENTS OF RETAINED EARNINGS, COMPREHENSIVE INCOME, AND PAID-IN CAPITAL
In thousands, for the years ended December 31, 2003 2002 2001
RETAINED EARNINGS
Retained Earnings – Beginning of period $3,938,693 $3,638,448 $3,190,639
Add: Earnings applicable to common stock 926,943 $926,943 599,360 $599,360 726,196 $726,196
Deduct:
Dividends declared on common stock 362,941 299,031 278,342
Capital stock and other expenses 187 84 45
Total 363,128 299,115 278,387
Retained Earnings – End of period $4,502,508 $3,938,693 $3,638,448
ACCUMULATED OTHER
COMPREHENSIVE INCOME (LOSS) (NET OF TAXES):
Balance at beginning of period:
Accumulated derivative instrument
fair value changes $ 17,313 $ (17,973) $ –
Other accumulated comprehensive (loss) items (39,673) (70,821) (75,033)
Total (22,360) (88,794) (75,033)
Cumulative effect to January 1, 2001
of accounting change regarding
fair value of derivative instruments – – (18,021)
Net derivative instrument fair value
changes arising during the period (43,124) (43,124) 35,286 35,286 48 48
Foreign currency translation adjustments 4,169 4,169 65,948 (15,487) 4,615 4,615
Minimum pension liability adjustment 1,153 1,153 (10,489) (10,489) – –
Net unrealized investment gains (losses) 52,367 52,367 (24,311) (24,311) (403) (403)
Balance at end of period:
Accumulated derivative
instrument fair value changes (25,811) 17,313 (17,973)
Other accumulated comprehensive income (loss) items 18,016 (39,673) (70,821)
Total $ (7,795) $ (22,360) $ (88,794)
Comprehensive Income $941,508 $584,359 $730,456
PAID-IN CAPITAL
Paid-in Capital – Beginning of period $4,666,753 $4,662,704 $4,660,483
Add:
Common stock issuances related to stock plans 100,862 4,049 2,221
Paid-in Capital – End of period $4,767,615 $4,666,753 $4,662,704
See Notes to Consolidated Financial Statements.