Entergy 2003 Annual Report Download - page 33
Download and view the complete annual report
Please find page 33 of the 2003 Entergy annual report below. You can navigate through the pages in the report by either clicking on the pages listed below, or by using the keyword search tool below to find specific information within the annual report.-
 1
1 -
2
-
3
-
4
-
5
-
6
-
7
-
8
-
9
-
10
-
11
-
12
-
13
-
14
-
15
-
16
-
17
-
18
-
19
-
20
-
21
-
22
-
 23
23 -
 24
24 -
 25
25 -
 26
26 -
 27
27 -
 28
28 -
 29
29 -
 30
30 -
 31
31 -
 32
32 -
 33
33 -
 34
34 -
 35
35 -
 36
36 -
 37
37 -
 38
38 -
 39
39 -
 40
40 -
 41
41 -
 42
42 -
 43
43 -
44
-
45
-
46
-
47
-
48
-
49
-
50
-
51
-
52
-
53
-
54
-
55
-
56
-
57
-
58
-
59
-
60
-
61
-
62
-
63
-
64
-
65
-
66
-
67
-
68
-
69
-
70
-
71
-
72
-
73
-
74
-
75
-
76
-
77
-
78
-
79
-
80
-
81
-
82
-
83
-
84
-
85
-
86
-
87
-
88
-
89
-
90
-
91
-
92
 |
 |

31
ENTERGY CORPORATION AND SUBSIDIARIES 2003
invested in “energy-related” businesses without specific SEC
approval. Entergy has made investments in energy-related
businesses, including power marketing and trading.
Entergy’s available capacity to make additional investments
at December 31, 2003 was approximately $1.6 billion.
SOURCES OF CAPITAL
Entergy’s sources to meet its capital requirements and to
fund potential investments include:
internally generated funds;
cash on hand ($692 million as of December 31, 2003);
securities issuances;
bank financing under new or existing facilities; and
sales of assets.
The majority of Entergy’s internally generated funds come
from the domestic utility companies and System Energy.
Circumstances such as weather patterns, price fluctuations,
and unanticipated expenses, including unscheduled plant
outages, could affect the level of internally generated funds
in the future. In the following section Entergy’s cash flow
activity for the previous three years is discussed.
Provisions within the Articles of Incorporation or pertinent
indentures and various other agreements relating to the
long-term debt and preferred stock of certain of Entergy
Corporation’s subsidiaries restrict the payment of cash
dividends or other distributions on their common and
preferred stock. As of December 31, 2003, Entergy
Arkansas and Entergy Mississippi had restricted retained
earnings unavailable for distribution to Entergy
Corporation of $309.4 million and $41.9 million, respectively.
Additionally, PUHCA prohibits Entergy Corporation’s
subsidiaries from making loans or advances to Entergy
Corporation. All debt and common and preferred stock
issuances by the domestic utility companies and System
Energy require prior regulatory approval, and their
preferred stock and debt issuances are also subject to
issuance tests set forth in corporate charters, bond inden-
tures, and other agreements. The domestic utility compa-
nies and System Energy have sufficient capacity under
these tests to meet foreseeable capital needs.
Short-term borrowings by the domestic utility companies
and System Energy, including borrowings under the intra-
company money pool, are limited to amounts authorized by
the SEC. Under the SEC order authorizing the short-term
borrowing limits, the domestic utility companies and
System Energy cannot incur new short-term indebtedness
if the issuer’s common equity would comprise less than
30% of its capital. See Note 4 to the consolidated financial
statements for further discussion of Entergy’s short-term
borrowing limits.
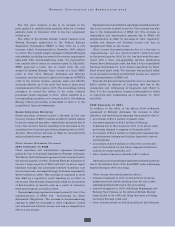
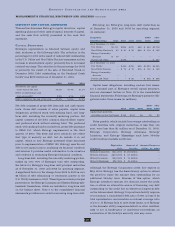
CASH FLOW ACTIVITY
As shown in Entergy’s Statements of Cash Flows, cash
flows for the years ended December 31, 2003, 2002, and
2001 were as follows (in millions):
2003 2002 2001
Cash and cash equivalents
at beginning of period $ 1,335 $ 752 $ 1,382
Cash flow provided by (used in):
Operating activities 2,006 2,181 2,216
Investing activities (1,783) (1,388) (2,224)
Financing activities (869) (213) (622)
Effect of exchange rates on
cash and cash equivalents 3 3 –
Net increase (decrease) in
cash and cash equivalents (643) 583 (630)
Cash and cash equivalents
at end of period $ 692 $ 1,335 $ 752
Operating Cash Flow Activity
2003 COMPARED TO 2002
Entergy’s cash flow provided by operating activities
decreased in 2003 primarily due to the following:
The U.S. Utility provided $1,675 million in operating
cash flow in 2003 compared to providing $2,341 million
in 2002. The decrease primarily resulted from the tax
accounting election made by Entergy Louisiana, as
discussed below. Also contributing to the decrease were
higher payments for fuel during the period, which also
significantly increased the amount of deferred fuel
costs. Management expects that the deferred fuel costs
will be recovered through regulatory recovery mecha-
nisms currently in place.
The non-nuclear wholesale assets business used $70 million
in operating cash flow in 2003 compared to providing
$43 million in 2002 primarily due to a decrease of
$64 million in the income tax refund received in 2003
compared to 2002. Also contributing to the increase in
cash used was a one-time $33 million payment related
to a generation contract in the non-nuclear wholesale
assets business.
The Non-Utility Nuclear segment provided $183 million
in operating cash flow in 2003 compared to providing
$282 million in 2002 primarily due to higher tax
payments and unplanned outages.
Operating cash flow used by the investment in Entergy-
Koch, LP decreased by $6 million in 2003. This decrease
in cash flow used was due to the receipt of $100 million
in dividends from Entergy-Koch in 2003. Almost entirely
offsetting the dividends received was an increase in tax
payments related to Entergy’s investment in Entergy-
Koch due to increased income from the investment.