Entergy 2003 Annual Report Download - page 54
Download and view the complete annual report
Please find page 54 of the 2003 Entergy annual report below. You can navigate through the pages in the report by either clicking on the pages listed below, or by using the keyword search tool below to find specific information within the annual report.-
 1
1 -
2
-
3
-
4
-
5
-
6
-
7
-
8
-
9
-
10
-
11
-
12
-
13
-
14
-
15
-
16
-
17
-
18
-
19
-
20
-
21
-
22
-
23
-
24
-
25
-
26
-
27
-
28
-
29
-
30
-
31
-
32
-
33
-
34
-
35
-
36
-
37
-
38
-
39
-
40
-
41
-
42
-
43
-
 44
44 -
 45
45 -
 46
46 -
 47
47 -
 48
48 -
 49
49 -
 50
50 -
 51
51 -
 52
52 -
 53
53 -
 54
54 -
 55
55 -
 56
56 -
 57
57 -
 58
58 -
 59
59 -
 60
60 -
 61
61 -
 62
62 -
 63
63 -
 64
64 -
65
-
66
-
67
-
68
-
69
-
70
-
71
-
72
-
73
-
74
-
75
-
76
-
77
-
78
-
79
-
80
-
81
-
82
-
83
-
84
-
85
-
86
-
87
-
88
-
89
-
90
-
91
-
92
 |
 |

52
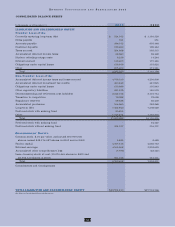
ENTERGY CORPORATION AND SUBSIDIARIES 2003
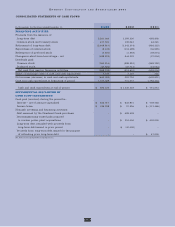
CONSOLIDATED BALANCE SHEETS
In thousands, as of December 31, 2003 2002
ASSETS
CURRENT ASSETS:
Cash and cash equivalents:
Cash $ 115,112 $ 169,788
Temporary cash investments—at cost, which approximates market 576,813 1,165,260
Special deposits 308 280
Total cash and cash equivalents 692,233 1,335,328
Other temporary investments 50,000 –
Notes receivable 1,730 2,078
Accounts receivable:
Customer 398,091 323,215
Allowance for doubtful accounts (25,976) (27,285)
Other 246,824 244,621
Accrued unbilled revenues 384,860 319,133
Total receivables 1,003,799 859,684
Deferred fuel costs 245,973 55,653
Fuel inventory—at average cost 110,482 96,467
Materials and supplies—at average cost 548,921 525,900
Deferred nuclear refueling outage costs 138,836 163,646
Prepayments and other 127,270 166,827
Total 2,919,244 3,205,583
OTHER PROPERTY AND INVESTMENTS:
Investment in affiliates—at equity 1,053,328 824,209
Decommissioning trust funds 2,278,533 2,069,198
Non-utility property—at cost (less accumulated depreciation) 262,384 297,294
Other 152,681 277,539
Total 3,746,926 3,468,240
PROPERTY, PLANT AND EQUIPMENT:
Electric 28,035,899 26,789,538
Property under capital lease 751,815 746,624
Natural gas 236,622 209,969
Construction work in progress 1,380,982 1,232,891
Nuclear fuel under capital lease 278,683 259,433
Nuclear fuel 234,421 263,609
Total property, plant and equipment 30,918,422 29,502,064
Less—accumulated depreciation and amortization 12,619,625 11,837,061
Property, plant and equipment—net 18,298,797 17,665,003
DEFERRED DEBITS AND OTHER ASSETS:
Regulatory assets:
SFAS 109 regulatory asset—net 830,539 844,105
Other regulatory assets 1,425,145 973,185
Long-term receivables 20,886 24,703
Goodwill 377,172 377,172
Other 935,501 946,375
Total 3,589,243 3,165,540
TOTAL ASSETS $28,554,210 $27,504,366
See Notes to Consolidated Financial Statements.