Entergy 2003 Annual Report Download - page 26
Download and view the complete annual report
Please find page 26 of the 2003 Entergy annual report below. You can navigate through the pages in the report by either clicking on the pages listed below, or by using the keyword search tool below to find specific information within the annual report.-
 1
1 -
2
-
3
-
4
-
5
-
6
-
7
-
8
-
9
-
10
-
11
-
12
-
13
-
14
-
15
-
 16
16 -
 17
17 -
 18
18 -
 19
19 -
 20
20 -
 21
21 -
 22
22 -
 23
23 -
 24
24 -
 25
25 -
 26
26 -
 27
27 -
 28
28 -
 29
29 -
 30
30 -
 31
31 -
 32
32 -
 33
33 -
 34
34 -
 35
35 -
 36
36 -
37
-
38
-
39
-
40
-
41
-
42
-
43
-
44
-
45
-
46
-
47
-
48
-
49
-
50
-
51
-
52
-
53
-
54
-
55
-
56
-
57
-
58
-
59
-
60
-
61
-
62
-
63
-
64
-
65
-
66
-
67
-
68
-
69
-
70
-
71
-
72
-
73
-
74
-
75
-
76
-
77
-
78
-
79
-
80
-
81
-
82
-
83
-
84
-
85
-
86
-
87
-
88
-
89
-
90
-
91
-
92
 |
 |

24
ENTERGY CORPORATION AND SUBSIDIARIES 2003
U.S. UTILITY
The decrease in earnings for the U.S. Utility for 2003 from
$583 million to $469 million was primarily due to a
$107.7 million ($65.6 million net-of-tax) accrual of the loss
that would be associated with a final, non-appealable decision
disallowing abeyed River Bend plant costs; $99.8 million
($70.1 million net-of-tax) of charges recorded in connection
with the voluntary severance program; and the $21.3 million
net-of-tax cumulative effect of a change in accounting
principle that reduced earnings at Entergy Gulf States in
the first quarter of 2003 upon implementation of SFAS 143.
See “Critical Accounting Estimates - SFAS 143” below for
discussion of the implementation of SFAS 143. Partially
offsetting the decrease in earnings were decreased interest
charges and increased net revenue.
The increase in earnings for the U.S. Utility for 2002 from
$550 million to $583 million was primarily due to an
increase in net revenue and a decrease in interest charges,
partially offset by increases in depreciation and amortization
expenses and other operation and maintenance expenses.
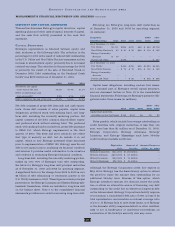
Net Revenue
2003 COMPARED TO 2002
Net revenue, which is Entergy’s measure of gross margin,
consists of operating revenues net of: 1) fuel, fuel-related,
and purchased power expenses; and 2) other regulatory
credits. Following is an analysis of the change in net revenue
comparing 2003 to 2002 (in millions):
2002 net revenue $4,209.6
Base rate increases 66.2
Base rate decreases (23.3)
Fuel price 56.2
Asset retirement obligation 42.9
Net wholesale revenue 23.2
March 2002 Arkansas settlement agreement (154.0)
Other (6.3)
2003 net revenue $4,214.5
Base rates increased net revenue due to base rate increases
at Entergy Mississippi and Entergy New Orleans that
became effective in January 2003 and June 2003, respec-
tively. Entergy Gulf States implemented base rate decreases
in its Louisiana jurisdiction effective June 2002 and
January 2003. The January 2003 base rate decrease of
$22.1 million has a minimal impact on net income due to a
corresponding reduction in nuclear depreciation and
decommissioning expenses associated with the change in
accounting estimate to reflect an assumed extension of
River Bend’s useful life.
The fuel price variance is due to a revised estimate made
in December 2002 of the fuel cost component of the price
applied to unbilled sales and further revision of that
estimate in the first quarter of 2003.
The asset retirement obligation variance is due to the
implementation of SFAS 143, “Accounting for Asset
Retirement Obligations,” adopted in January 2003. See
“Critical Accounting Estimates” for more details on SFAS
143. The increase is offset by increased depreciation and
decommissioning expenses and has no effect on net income.
The increase in net wholesale revenue is primarily due
to an increase in sales volume to municipal and cooperative
customers.
The March 2002 settlement agreement variance reflects
the absence in 2003 of the effect of recording the ice storm
settlement approved by the Arkansas Public Service
Commission (APSC) in 2002. This settlement resulted in
previously deferred revenues at Entergy Arkansas per the
transition cost account mechanism being recorded in net
revenue in the second quarter of 2002. The decrease is offset
by a corresponding decrease in other operation and mainte-
nance expenses and has a minimal effect on net income.
Gross Operating Revenues and Regulatory Credits
Gross operating revenues include an increase in fuel cost
recovery revenues of $682 million and $53 million in electric
and gas sales, respectively, primarily due to higher fuel rates
in 2003 resulting from increases in the market prices of pur-
chased power and natural gas. As such, this revenue increase
is offset by increased fuel and purchased power expenses.
Other regulatory credits decreased primarily due to the
March 2002 settlement agreement mentioned above, which
increased other regulatory credits in 2002 to offset other
operation and maintenance expenses of $159.9 million related
to the December 2000 ice storms. The decrease was partially
offset by the asset retirement obligation mentioned above,
which increased other regulatory credits in 2003 to offset the
increases in depreciation and decommissioning expenses.
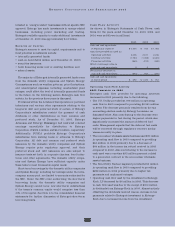
2002 COMPARED TO 2001
Following is an analysis of the change in net revenue
comparing 2002 to 2001 (in millions):
2001 net revenue $3,873.1
March 2002 Arkansas settlement agreement 180.7
Volume/weather 155.7
Fuel price 94.3
System Energy refund in 2001 (128.9)
Other 34.7
2002 net revenue $4,209.6
The March 2002 settlement agreement is discussed
above and is offset by an increase in other operation and
maintenance expenses. The effect on net income in 2002 is
a decrease of $2.2 million.
The volume/weather variance is due to increased electricity
usage in the service territories. Billed usage increased a total
of 2,149 GWh in the residential and commercial sectors.
MANAGEMENT’S FINANCIAL DISCUSSION AND ANALYSIS
continued