Entergy 2003 Annual Report Download - page 28
Download and view the complete annual report
Please find page 28 of the 2003 Entergy annual report below. You can navigate through the pages in the report by either clicking on the pages listed below, or by using the keyword search tool below to find specific information within the annual report.-
 1
1 -
2
-
3
-
4
-
5
-
6
-
7
-
8
-
9
-
10
-
11
-
12
-
13
-
14
-
15
-
16
-
17
-
 18
18 -
 19
19 -
 20
20 -
 21
21 -
 22
22 -
 23
23 -
 24
24 -
 25
25 -
 26
26 -
 27
27 -
 28
28 -
 29
29 -
 30
30 -
 31
31 -
 32
32 -
 33
33 -
 34
34 -
 35
35 -
 36
36 -
 37
37 -
 38
38 -
39
-
40
-
41
-
42
-
43
-
44
-
45
-
46
-
47
-
48
-
49
-
50
-
51
-
52
-
53
-
54
-
55
-
56
-
57
-
58
-
59
-
60
-
61
-
62
-
63
-
64
-
65
-
66
-
67
-
68
-
69
-
70
-
71
-
72
-
73
-
74
-
75
-
76
-
77
-
78
-
79
-
80
-
81
-
82
-
83
-
84
-
85
-
86
-
87
-
88
-
89
-
90
-
91
-
92
 |
 |

26
ENTERGY CORPORATION AND SUBSIDIARIES 2003
The decrease was partially offset by an increase in “miscel-
laneous – net” of $26.7 million due to the cessation of amor-
tization of goodwill in January 2002 upon implementation
of SFAS 142 and settlement of liability insurance coverage
at Entergy Gulf States.
Interest and other charges decreased primarily due to:
a decrease of $31.9 million in interest on long-term debt
primarily due to the retirement of long-term debt in late
2001 and early 2002; and
a decrease of $76.0 million in other interest expense
primarily due to interest recorded on System Energy’s
provision for rate refund in 2001 resulting from the
effects of the final FERC order addressing System
Energy’s 1995 rate filing. The refund was made in
December 2001.
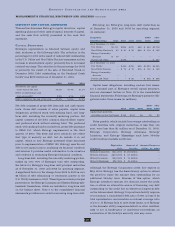
NON-UTILITY NUCLEAR
Following are key performance measures:
2003 2002 2001
Net MW in operation at December 31 4,001 3,955 3,445
Average realized price per MWh $38.54 $40.49 $34.90
Generation in GWh for the year 32,379 29,953 22,614
Capacity factor for the year 92.4% 92.8% 92.7%
2003 COMPARED TO 2002
The increase in earnings for Non-Utility Nuclear from
$200.5 million to $300.8 million was primarily due to the
$154.5 million net-of-tax cumulative effect of a change in
accounting principle recognized in the first quarter of 2003
upon implementation of SFAS 143. See “Critical Accounting
Estimates – SFAS 143” below for discussion of the imple-
mentation of SFAS 143. Income before the cumulative effect
of accounting change decreased by $54.2 million. The
decrease was primarily due to $83.0 million ($50.6 million
net-of-tax) of charges recorded in connection with the
voluntary severance program. Except for the effect of the
voluntary severance program, operation and maintenance
expenses in 2003 per MWh of generation were in line with
2002 operation and maintenance expenses.
2002 COMPARED TO 2001
The increase in earnings for Non-Utility Nuclear from
$127.9 million to $200.5 million was primarily due to
the acquisitions of Indian Point 2, purchased in September
2001, and Vermont Yankee, purchased in July 2002. Also
contributing to the increase in earnings was higher pricing
under certain purchase power contracts.
ENERGY COMMODITY SERVICES
Earnings for Energy Commodity Services in 2003 were
primarily driven by Entergy’s investment in Entergy-Koch.
Following are key performance measures for Entergy-
Koch’s operations for 2003, 2002, and 2001:
2003 2002 2001
Entergy-Koch Trading
Gas volatility 62% 61% 72%
Electricity volatility 59% 48% 78%
Gas marketed (BCF/D) (1) 6.5 5.8 4.5
Electricity marketed (GWh) 445,979 408,038 180,893
Gain/loss days 1.5 1.8 2.8
Gulf South Pipeline
Throughput (BCF/D) 1.99 2.40 2.45
Production cost ($/MMBtu) $0.146 $0.094 $0.093
(1) Previously reported volumes, which included only U.S. trading, have been adjusted
to reflect both U.S. and Europe volumes traded.
2003 COMPARED TO 2002
The increase in earnings for Energy Commodity Services in
2003 from a $145.8 million loss to $180.5 million in earnings
was primarily due to $428.5 million ($238.3 million net-of-
tax) of charges recorded in 2002, as discussed in the 2002 to
2001 comparison below. Higher earnings from Entergy’s
investment in Entergy-Koch also contributed to the increase
in earnings. The income from Entergy’s investment in
Entergy-Koch was $73 million higher in 2003 primarily as a
result of higher earnings at Entergy-Koch Trading (EKT).
Volatility was slightly up and trading earnings reflected
solid point-of-view trading results. In addition, EKT’s phys-
ical optimization business continued to contribute earnings,
and its European business earnings increased as trading
activities continued to expand beyond the United Kingdom.
Earnings at Gulf South Pipeline were lower due to lower
throughput and higher production costs. The decreased
throughput was due to shifting gas flow patterns in a
sustained high gas price environment that led to higher
fuel costs. Production costs were higher as the result of
incremental legal and consultant expenses incurred primarily
in connection with Gulf South’s defense of a lawsuit which it
believes has no merit.
Entergy accounts for its 50% share in Entergy-Koch
under the equity method of accounting. Earnings from
Entergy-Koch are reported as equity in earnings of uncon-
solidated equity affiliates in the financial statements.
Certain terms of the partnership arrangement allocated
income from various sources, and the taxes on that income,
on a significantly disproportionate basis through 2003.
Losses and distributions from operations are allocated to
the partners equally. Substantially all of Entergy-Koch’s
profits were allocated to Entergy in 2003, 2002, and 2001.
Effective January 1, 2004, a revaluation of Entergy-Koch’s
assets for legal capital account purposes occurred, and
future profit allocations changed after the revaluation.
The profit allocations other than for weather trading and
MANAGEMENT’S FINANCIAL DISCUSSION AND ANALYSIS
continued
“Non-Utility Nuclear contributed
over 30% of Entergy’s 2003
net income.”