Entergy 2003 Annual Report Download - page 25
Download and view the complete annual report
Please find page 25 of the 2003 Entergy annual report below. You can navigate through the pages in the report by either clicking on the pages listed below, or by using the keyword search tool below to find specific information within the annual report.-
 1
1 -
2
-
3
-
4
-
5
-
6
-
7
-
8
-
9
-
10
-
11
-
12
-
13
-
14
-
 15
15 -
 16
16 -
 17
17 -
 18
18 -
 19
19 -
 20
20 -
 21
21 -
 22
22 -
 23
23 -
 24
24 -
 25
25 -
 26
26 -
 27
27 -
 28
28 -
 29
29 -
 30
30 -
 31
31 -
 32
32 -
 33
33 -
 34
34 -
 35
35 -
36
-
37
-
38
-
39
-
40
-
41
-
42
-
43
-
44
-
45
-
46
-
47
-
48
-
49
-
50
-
51
-
52
-
53
-
54
-
55
-
56
-
57
-
58
-
59
-
60
-
61
-
62
-
63
-
64
-
65
-
66
-
67
-
68
-
69
-
70
-
71
-
72
-
73
-
74
-
75
-
76
-
77
-
78
-
79
-
80
-
81
-
82
-
83
-
84
-
85
-
86
-
87
-
88
-
89
-
90
-
91
-
92
 |
 |

23
ENTERGY CORPORATION AND SUBSIDIARIES 2003
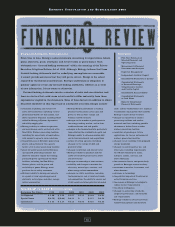
Entergy Corporation is an investor-owned public utility
holding company that operates primarily through three
business segments.
U.S. UTILITY generates, transmits, distributes, and
sells electric power, with a small amount of natural gas
distribution.
NON-UTILITY NUCLEAR owns and operates five nuclear
power plants and sells the electric power produced by
those plants to wholesale customers. This business also
provides services to other nuclear power plant owners.
ENERGY COMMODITY SERVICES provides energy
commodity trading and gas transportation and storage
services through Entergy-Koch, LP. Energy Commodity
Services also includes Entergy’s non-nuclear wholesale
assets business, which sells electric power produced by
those assets to wholesale customers while it focuses on
selling the majority of those assets.
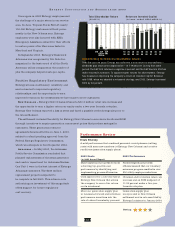
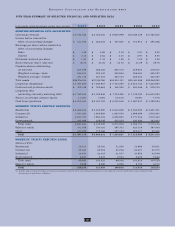
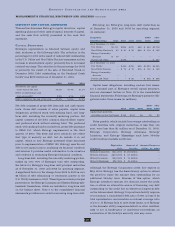
Following are the percentages of Entergy’s consolidated
revenues and net income generated by these segments and
the percentage of total assets held by them:
% of Revenue
Segment 2003 2002 2001
U.S. Utility 82 82 77
Non-Utility Nuclear 14 14 8
Energy Commodity Services 2 4 14
Parent & Other 2 – 1
% of Net Income
Segment 2003 2002 2001
U.S. Utility 52 97 77
Non-Utility Nuclear 32 32 17
Energy Commodity Services 19 (23) 14
Parent & Other (3) (6) (8)
% of Total Assets
Segment 2003 2002 2001
U.S. Utility 79 79 78
Non-Utility Nuclear 15 16 13
Energy Commodity Services 7 8 9
Parent & Other (1) (3) –
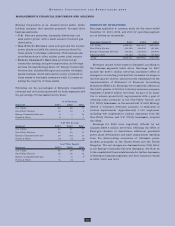
RESULTS OF OPERATIONS
Earnings applicable to common stock for the years ended
December 31, 2003, 2002, and 2001 by operating segment
are as follows (in thousands):
Operating Segment 2003 2002 2001
U.S. Utility $469,050 $583,251 $550,243
Non-Utility Nuclear 300,799 200,505 127,880
Energy Commodity Services 180,454 (145,830) 105,939
Parent & Other (23,360) (38,566) (57,866)
Total $926,943 $599,360 $726,196
Entergy’s income before taxes is discussed according to
the business segments listed above. Earnings for 2003
include the $137.1 million net-of-tax cumulative effect of
changes in accounting principle that increased earnings in
the first quarter of 2003, almost entirely resulting from the
implementation of Statement of Financial Accounting
Standards (SFAS) 143. Earnings were negatively affected in
the fourth quarter of 2003 by voluntary severance program
expenses of $122.8 million net-of-tax. As part of an initia-
tive to achieve productivity improvements with a goal of
reducing costs, primarily in the Non-Utility Nuclear and
U.S. Utility businesses, in the second half of 2003 Entergy
offered a voluntary severance program to employees in
various departments. Approximately 1,100 employees,
including 650 employees in nuclear operations from the
Non-Utility Nuclear and U.S. Utility businesses, accepted
the offers.
Earnings for 2002 were negatively affected by net
charges ($238.3 million net-of-tax) reflecting the effect of
Entergy’s decision to discontinue additional greenfield
power plant development and asset impairments resulting
from the deteriorating economics of wholesale power
markets principally in the United States and the United
Kingdom. The net charges are discussed more fully below
in the Energy Commodity Services discussion. See Note 12
to the consolidated financial statements for further discussion
of Entergy’s business segments and their financial results
in 2003, 2002, and 2001.
MANAGEMENT’S FINANCIAL DISCUSSION AND ANALYSIS