Entergy 2003 Annual Report Download - page 38
Download and view the complete annual report
Please find page 38 of the 2003 Entergy annual report below. You can navigate through the pages in the report by either clicking on the pages listed below, or by using the keyword search tool below to find specific information within the annual report.-
 1
1 -
2
-
3
-
4
-
5
-
6
-
7
-
8
-
9
-
10
-
11
-
12
-
13
-
14
-
15
-
16
-
17
-
18
-
19
-
20
-
21
-
22
-
23
-
24
-
25
-
26
-
27
-
 28
28 -
 29
29 -
 30
30 -
 31
31 -
 32
32 -
 33
33 -
 34
34 -
 35
35 -
 36
36 -
 37
37 -
 38
38 -
 39
39 -
 40
40 -
 41
41 -
 42
42 -
 43
43 -
 44
44 -
 45
45 -
 46
46 -
 47
47 -
 48
48 -
49
-
50
-
51
-
52
-
53
-
54
-
55
-
56
-
57
-
58
-
59
-
60
-
61
-
62
-
63
-
64
-
65
-
66
-
67
-
68
-
69
-
70
-
71
-
72
-
73
-
74
-
75
-
76
-
77
-
78
-
79
-
80
-
81
-
82
-
83
-
84
-
85
-
86
-
87
-
88
-
89
-
90
-
91
-
92
 |
 |

36
ENTERGY CORPORATION AND SUBSIDIARIES 2003
MANAGEMENT’S FINANCIAL DISCUSSION AND ANALYSIS
continued
MARKET AND CREDIT RISKS
Market risk is the risk of changes in the value of commodity
and financial instruments, or in future operating results or
cash flows, in response to changing market conditions.
Entergy is exposed to the following significant market risks:
The commodity price risk associated with Entergy’s
Non-Utility Nuclear and Energy Commodity Services
segments.
The foreign currency exchange rate risk associated
with certain of Entergy’s contractual obligations.
The interest rate and equity price risk associated with
Entergy’s investments in decommissioning trust funds.
Entergy is also exposed to credit risk. Credit risk is the risk
of loss from nonperformance by suppliers, customers, or
financial counterparties to a contract or agreement. Where
it is a significant consideration, counterparty credit risk is
addressed in the discussions that follow.
Commodity Price Risk
POWER GENERATION
The sale of electricity from the power generation plants
owned by Entergy’s Non-Utility Nuclear business and
Energy Commodity Services, unless otherwise contracted,
is subject to the fluctuation of market power prices.
Entergy’s Non-Utility Nuclear business has entered into
power purchase agreements (PPAs) and other contracts to
sell the power produced by its power plants at prices
established in the PPAs. Entergy continues to pursue oppor-
tunities to extend the existing PPAs and to enter into
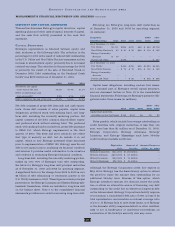
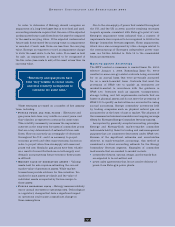
new PPAs with other parties. Following is a summary of
the amount of the Non-Utility Nuclear business’ output
that is currently sold forward under physical or financial
contracts at fixed prices:
2004 2005 2006 2007 2008
Non-Utility Nuclear:
% of planned generation
sold forward 100% 52% 32% 16% 4%
Planned generation (GWh) 32,787 34,164 34,853 34,517 34,513
Average price per MWh $38 $37 $35 $34 $38
The Vermont Yankee acquisition included a 10-year PPA,
which is through the expiration of the current operating
license for the plant, under which the former owners will
buy the power produced by the plant. The PPA includes an
adjustment clause under which the prices specified in the
PPA will be adjusted downward annually, beginning in
November 2005, if power market prices drop below PPA
prices. Accordingly, because the price is not fixed, the table
above does not report power from that plant as sold forward
after October 2005. Approximately 2% of Non-Utility
Nuclear’s planned generation in 2005, 13% in 2006, 12% in
2007, and 13% in 2008 is under contract from Vermont
Yankee after October 2005.
Under the PPAs with NYPA for the output of power from
Indian Point 3 and FitzPatrick, the Non-Utility Nuclear
business is obligated to produce at an average capacity
factor of 85% with a financial true-up payment to NYPA
should NYPA’s cost to purchase power due to an output
shortfall be higher than the PPAs’ price. The calculation of
any true-up payments is based on two two-year periods. For
the first period, which ran through November 20, 2002,
Indian Point 3 and FitzPatrick operated at 95% and 97%,
respectively, under the true-up formula. Credits of up to 5%
reflecting period one generation above 85% can be used to
offset any output shortfalls in the second period, which
runs through the end of the PPAs on December 31, 2004.
Included in the planned generation sold forward
percentages are contracts entered into in 2003 that are not
unit contingent but are firm contracts containing liquidated
damages provisions. These firm contracts are for 1% of
Non-Utility Nuclear’s planned generation in 2005, 4% in
2006, 2% in 2007, and 0% in 2008.
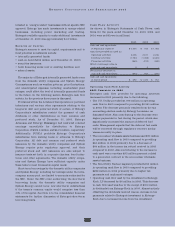
In addition to selling the power produced by its plants,
the Non-Utility Nuclear business sells installed capacity to
load-serving distribution companies in order for those
companies to meet requirements placed on them by the
Independent System Operators in their area. Following is
a summary of the amount of the Non-Utility Nuclear busi-
ness’ installed capacity that is currently sold forward, and
the blended amount of the Non-Utility Nuclear business’
planned generation output and installed capacity that is
currently sold forward:
2004 2005 2006 2007 2008
Non-Utility Nuclear:
Percent of capacity sold forward:
Bundled capacity and
energy contracts 55% 15% 12% 13% 13%
Capacity contracts 28% 15% 6% 3% –
Total 83% 30% 18% 16% 13%
Planned MW in operation 4,111 4,203 4,203 4,203 4,203
Average capacity contract
price per kW per month $2.4 $1.3 $0.6 $0.7 N/A
Blended Capacity and Energy
(based on revenues)
% of planned generation and
capacity sold forward 99% 49% 28% 13% 4%
Average contract
revenue per MWh $ 39 $ 37 $ 35 $ 34 $ 38
As of December 31, 2003, approximately 99% of Entergy’s
counterparties to Non-Utility Nuclear’s energy and capacity
contracts have investment grade credit ratings.