Entergy 2003 Annual Report Download - page 39
Download and view the complete annual report
Please find page 39 of the 2003 Entergy annual report below. You can navigate through the pages in the report by either clicking on the pages listed below, or by using the keyword search tool below to find specific information within the annual report.-
 1
1 -
2
-
3
-
4
-
5
-
6
-
7
-
8
-
9
-
10
-
11
-
12
-
13
-
14
-
15
-
16
-
17
-
18
-
19
-
20
-
21
-
22
-
23
-
24
-
25
-
26
-
27
-
28
-
 29
29 -
 30
30 -
 31
31 -
 32
32 -
 33
33 -
 34
34 -
 35
35 -
 36
36 -
 37
37 -
 38
38 -
 39
39 -
 40
40 -
 41
41 -
 42
42 -
 43
43 -
 44
44 -
 45
45 -
 46
46 -
 47
47 -
 48
48 -
 49
49 -
50
-
51
-
52
-
53
-
54
-
55
-
56
-
57
-
58
-
59
-
60
-
61
-
62
-
63
-
64
-
65
-
66
-
67
-
68
-
69
-
70
-
71
-
72
-
73
-
74
-
75
-
76
-
77
-
78
-
79
-
80
-
81
-
82
-
83
-
84
-
85
-
86
-
87
-
88
-
89
-
90
-
91
-
92
 |
 |

37
ENTERGY CORPORATION AND SUBSIDIARIES 2003
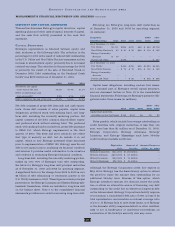
Following is a summary of the amount of Energy
Commodity Services’ output and installed capacity that
is currently sold forward under physical or financial
contracts at fixed prices:
2004 2005 2006 2007 2008
Energy Commodity Services:
Capacity
Planned MW in operation 1,911 1,911 1,911 1,911 1,911
% of capacity sold forward 43% 43% 34% 31% 26%
Energy
Planned generation (GWh) 3,321 3,348 3,337 3,545 4,015
% of planned generation
sold forward 64% 67% 52% 42% 39%
Blended Capacity and Energy
(based on revenues)
% of planned energy and
capacity sold forward 62% 66% 50% 41% 35%
Average contract
revenue per MWh $26 $25 $27 $31 $28
The increase in the planned generation sold forward
percentages from the percentages in the 2002 Annual
Report is attributable to Entergy Louisiana and Entergy
New Orleans contracts involving RS Cogen and
Independence 2 entered into in 2003. These contracts are
still subject to a FERC review proceeding scheduled for
hearing later in 2004.
Entergy continually monitors industry trends in order to
determine whether asset impairments or other losses could
result from a decline in value, or cancellation, of merchant
power projects, and records provisions for impairments and
losses accordingly.
MARKETING AND TRADING
The earnings of Entergy’s Energy Commodity Services
segment are exposed to commodity price market risks
primarily through Entergy’s 50%-owned, unconsolidated
investment in Entergy-Koch. Entergy-Koch Trading (EKT)
uses value-at-risk models as one measure of the market risk
of a loss in fair value for EKT’s natural gas and power
trading portfolio. Actual future gains and losses in portfolios
will differ from those estimated based upon actual fluctua-
tions in market rates, operating exposures, and the timing
thereof, and changes in the portfolio of derivative financial
instruments during the year.
To manage its portfolio, EKT enters into various
derivative and contractual transactions in accordance with
the policy approved by the trading committee of the governing
board of Entergy-Koch. The trading portfolio consists of
physical and financial natural gas and power as well as other
energy and weather-related contracts. These contracts take
many forms, including futures, forwards, swaps, and options.
Characteristics of EKT’s value-at-risk method and the use
of that method are as follows:
Value-at-risk is used in conjunction with stress testing,
position reporting, and profit and loss reporting in
order to measure and control the risk inherent in the
trading and mark-to-market portfolios.
EKT estimates its value-at-risk using a model based on
J.P. Morgan’s Risk Metrics methodology combined with
a Monte Carlo simulation approach.
EKT estimates its daily value-at-risk for natural gas
and power using a 97.5% confidence level. EKT’s daily
value-at-risk is a measure that indicates that, if prices
moved against the positions, the loss in neutralizing the
portfolio would not be expected to exceed the calculated
value-at-risk.
EKT seeks to limit the daily value-at-risk on any given
day to a certain dollar amount approved by the trading
committee.
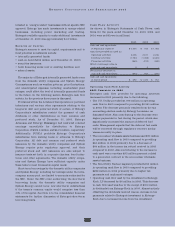
EKT’s value-at-risk measures, which it calls Daily Earnings
at Risk (DE@R), for its trading portfolio were as follows
(in millions):
2003 2002 2001
DE@R at the end of the year $ 9.6 $15.2 $5.5
Average DE@R for the year $13.6 $10.8 $6.4
Low DE@R for the year $ 5.9 $ 6.6 $3.6
High DE@R for the year $35.2 $16.9 $8.0
EKT’s DE@R at the end of the year was lower in 2003
compared to 2002 as a result of reduced strength of point-of-
view during the second half of 2003. EKT’s average DE@R
increased in 2003 compared to 2002 as a result of an increase
in the size of the position held, particularly during the first
quarter of 2003. EKT’s average DE@R increased in 2002
compared to 2001 as a result of an increase in the size of the
position held and an increase in the volatility of natural gas
prices in the latter part of the year.
For all derivative and contractual transactions, EKT is
exposed to losses in the event of nonperformance by counter-
parties to these transactions. Relevant considerations when
assessing EKT’s credit risk exposure include:
EKT’s operations are primarily concentrated in the
energy industry.
EKT’s trade receivables and other financial instruments
are predominantly with energy, utility, and financial
services related companies, as well as other trading
companies in the U.S., UK, and Western Europe.
EKT maintains credit policies, which its management
believes minimize overall credit risk.
Prospective and existing customers are reviewed for
creditworthiness based upon pre-established standards,
with customers not meeting minimum standards
providing various secured payment terms, including
the posting of cash collateral.