Entergy 2003 Annual Report Download - page 30
Download and view the complete annual report
Please find page 30 of the 2003 Entergy annual report below. You can navigate through the pages in the report by either clicking on the pages listed below, or by using the keyword search tool below to find specific information within the annual report.-
 1
1 -
2
-
3
-
4
-
5
-
6
-
7
-
8
-
9
-
10
-
11
-
12
-
13
-
14
-
15
-
16
-
17
-
18
-
19
-
 20
20 -
 21
21 -
 22
22 -
 23
23 -
 24
24 -
 25
25 -
 26
26 -
 27
27 -
 28
28 -
 29
29 -
 30
30 -
 31
31 -
 32
32 -
 33
33 -
 34
34 -
 35
35 -
 36
36 -
 37
37 -
 38
38 -
 39
39 -
 40
40 -
41
-
42
-
43
-
44
-
45
-
46
-
47
-
48
-
49
-
50
-
51
-
52
-
53
-
54
-
55
-
56
-
57
-
58
-
59
-
60
-
61
-
62
-
63
-
64
-
65
-
66
-
67
-
68
-
69
-
70
-
71
-
72
-
73
-
74
-
75
-
76
-
77
-
78
-
79
-
80
-
81
-
82
-
83
-
84
-
85
-
86
-
87
-
88
-
89
-
90
-
91
-
92
 |
 |

28
ENTERGY CORPORATION AND SUBSIDIARIES 2003
LIQUIDITY AND CAPITAL RESOURCES
This section discusses Entergy’s capital structure, capital
spending plans and other uses of capital, sources of capital,
and the cash flow activity presented in the cash flow
statement.
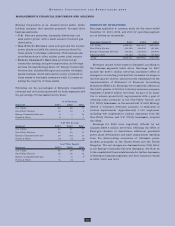
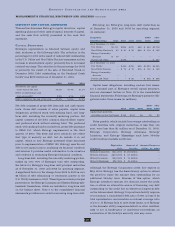
CAPITAL STRUCTURE
Entergy’s capitalization is balanced between equity and
debt, as shown in the following table. The reduction in the
percentage for 2003 is the result of reduced debt outstanding
in the U.S. Utility and Non-Utility Nuclear businesses, and an
increase in shareholders’ equity, primarily due to increased
retained earnings. The reduction in the percentage for 2002
is primarily the result of the sale of Damhead Creek in
December 2002. Debt outstanding on the Damhead Creek
facility was $458 million as of December 31, 2001.
2003 2002 2001
Net debt to net capital
at the end of the year 45.3% 47.7% 51.1%
Effect of subtracting cash
from gross debt 2.2% 4.1% 2.2%
Debt to capital at the end of the year 47.5% 51.8% 53.3%
Net debt consists of gross debt less cash and cash equiva-
lents. Gross debt consists of notes payable, capital lease
obligations, preferred stock with sinking fund, and long-
term debt, including the currently maturing portion. Net
capital consists of net debt, common shareholders’ equity,
and preferred stock without sinking fund. The preferred
stock with sinking fund is included in gross debt pursuant
to SFAS 150, which Entergy implemented in the third
quarter of 2003. The 2002 and 2001 ratios do not reflect
that type of security as debt, but do include it in net
capital, which is how Entergy presented those securities
prior to implementation of SFAS 150. Entergy uses the net
debt to net capital ratio in analyzing its financial condition
and believes it provides useful information to its investors
and creditors in evaluating Entergy’s financial condition.
Long-term debt, including the currently maturing portion,
makes up over 90% of Entergy’s total debt outstanding.
See below for Entergy’s long-term debt principal maturities
as of December 31, 2003 and 2002 by operating segment.
A significant factor in the change from 2002 to 2003 is over
$2 billion of debt refinancing or retirement activity in the
U.S. Utility business in 2003. These figures include principal
payments on the Entergy Louisiana and System Energy sale-
leaseback transactions, which are included in long-term debt
on the balance sheet. Note 5 to the consolidated financial
statements provides more detail concerning long-term debt.
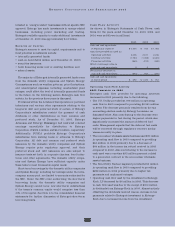
Following are Entergy’s long-term debt maturities as
of December 31, 2003 and 2002 by operating segment
(in millions):
Long-term 2007- after
Debt Maturities 2003 2004 2005 2006 2008 2008
As of December 31, 2002
U.S. Utility $1,111 $855 $470 $68 $ 654 $3,718
Non-Utility Nuclear $ 87 $ 91 $ 95 $98 $ 119 $ 193
Energy Commodity
Services $ 79 – – – – –
Parent and Other – $595 – – – $ 267
As of December 31, 2003
U.S. Utility – $450 $355 $28 $1,254 $4,345
Non-Utility Nuclear – $ 74 $ 72 $76 $ 100 $ 193
Energy Commodity
Services –––– – –
Parent and Other – – $ 60 – $ 272 $ 568
Capital lease obligations, including nuclear fuel leases,
are a minimal part of Entergy’s overall capital structure,
and are discussed further in Note 10 to the consolidated
financial statements. Following are Entergy’s payment obli-
gations under those leases (in millions):
2007- after
2004 2005 2006 2008 2008
Capital lease payments,
including nuclear fuel leases $165 $142 $6 $5 $3
Notes payable, which include borrowings outstanding on
credit facilities with original maturities of less than one
year, were less than $1 million as of December 31, 2003.
Entergy Corporation, Entergy Arkansas, Entergy
Louisiana, and Entergy Mississippi each have 364-day
credit facilities available as follows:
Expiration Amount of Amount Drawn as
Company Date Facility of Dec. 31, 2003
Entergy Corporation May 2004 $1.450 billion –
Entergy Arkansas April 2004 $ 63 million –
Entergy Louisiana May 2004 $ 15 million –
Entergy Mississippi May 2004 $ 25 million –
Although the Entergy Corporation credit line expires in
May 2004, Entergy has the discretionary option to extend
the period to repay the amount then outstanding for an
additional 364-day term. Because of this option, which
Entergy intends to exercise if it does not renew the credit
line or obtain an alternative source of financing, any debt
outstanding on the credit line is reflected in long-term debt
on the balance sheet. Entergy Corporation’s facility requires
it to maintain a consolidated debt ratio of 65% or less of its
total capitalization, and maintain an interest coverage ratio
of 2 to 1. If Entergy fails to meet these limits, or if Entergy
or the domestic utility companies default on other indebted-
ness or are in bankruptcy or insolvency proceedings, an
acceleration of the facility’s maturity date may occur.
MANAGEMENT’S FINANCIAL DISCUSSION AND ANALYSIS
continued