Dollar Tree 2015 Annual Report Download - page 71
Download and view the complete annual report
Please find page 71 of the 2015 Dollar Tree annual report below. You can navigate through the pages in the report by either clicking on the pages listed below, or by using the keyword search tool below to find specific information within the annual report.-
 1
1 -
2
-
3
-
4
-
5
-
6
-
7
-
8
-
9
-
10
-
11
-
12
-
13
-
14
-
15
-
16
-
17
-
18
-
19
-
20
-
21
-
22
-
23
-
24
-
25
-
26
-
27
-
28
-
29
-
30
-
31
-
32
-
33
-
34
-
35
-
36
-
37
-
38
-
39
-
40
-
41
-
42
-
43
-
44
-
45
-
46
-
47
-
48
-
49
-
50
-
51
-
52
-
53
-
54
-
55
-
56
-
57
-
58
-
59
-
60
-
 61
61 -
 62
62 -
 63
63 -
 64
64 -
 65
65 -
 66
66 -
 67
67 -
 68
68 -
 69
69 -
 70
70 -
 71
71 -
 72
72 -
 73
73 -
 74
74 -
 75
75 -
 76
76 -
 77
77 -
 78
78 -
 79
79 -
 80
80 -
 81
81 -
82
-
83
-
84
-
85
-
86
-
87
-
88
-
89
-
90
-
91
-
92
-
93
-
94
-
95
-
96
-
97
-
98
-
99
-
100
-
101
-
102
-
103
-
104
-
105
-
106
-
107
-
108
-
109
-
110
-
111
-
112
 |
 |

55
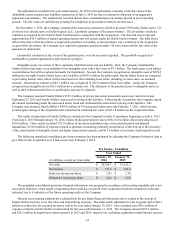
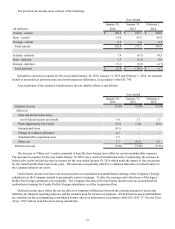
The unaudited pro forma results do not reflect events that either have occurred or may occur after the Acquisition,
including, but not limited to, the anticipated realization of ongoing savings from operating synergies in subsequent periods.
They also do not give effect to certain charges that the Company expects to incur in connection with the Acquisition, including,
but not limited to, additional professional fees, employee integration, retention and severance costs, potential asset
impairments, accelerated depreciation and amortization or product rationalization charges.
For additional discussion of the Acquisition, please see the "Acquisition" section included in "Item 7. Management's
Discussion and Analysis of Financial Condition and Results of Operations" beginning on page 26 of this Form 10-K.
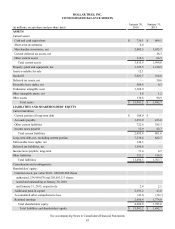
NOTE 3 - BALANCE SHEET COMPONENTS
Property, Plant and Equipment, Net
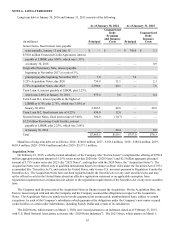
Property, plant and equipment, net, as of January 30, 2016 and January 31, 2015 consists of the following:
January 30, January 31,
(in millions) 2016 2015
Land $ 180.8 $ 79.0
Buildings 906.0 336.9
Leasehold improvements 1,556.7 1,068.2
Furniture, fixtures and equipment 2,457.8 1,385.2
Construction in progress 196.2 100.9
Total property, plant and equipment 5,297.5 2,970.2
Less: accumulated depreciation 2,172.0 1,759.7
Total property, plant and equipment, net $ 3,125.5 $ 1,210.5
Depreciation expense was $442.1 million, $206.0 million, and $190.7 million for the years ended January 30, 2016,
January 31, 2015, and February 1, 2014, respectively.
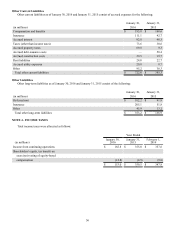
Other Current Assets
Other current assets as of January 30, 2016 and January 31, 2015 consist of the following:
January 30, January 31,
(in millions) 2016 2015
Accounts receivable - divestiture-related $ 76.9 $ —
Other accounts receivable 77.8 11.0
Prepaid store supplies 42.1 18.0
Prepaid rent 79.0 25.8
Other prepaid assets 34.5 11.7
Total other current assets $ 310.3 $ 66.5
Other Assets
Other assets as of January 30, 2016 and January 31, 2015 consist of the following:
January 30, January 31,
(in millions) 2016 2015
Long-term federal income tax benefit $ 10.3 $ 2.2
Restricted investments 82.0 78.9
Other long-term assets 38.5 9.8
Total other assets $ 130.8 $ 90.9