Dollar Tree 2015 Annual Report Download - page 3
Download and view the complete annual report
Please find page 3 of the 2015 Dollar Tree annual report below. You can navigate through the pages in the report by either clicking on the pages listed below, or by using the keyword search tool below to find specific information within the annual report.-
 1
1 -
 2
2 -
 3
3 -
 4
4 -
 5
5 -
 6
6 -
 7
7 -
 8
8 -
 9
9 -
 10
10 -
 11
11 -
 12
12 -
 13
13 -
 14
14 -
15
-
16
-
17
-
18
-
19
-
20
-
21
-
22
-
23
-
24
-
25
-
26
-
27
-
28
-
29
-
30
-
31
-
32
-
33
-
34
-
35
-
36
-
37
-
38
-
39
-
40
-
41
-
42
-
43
-
44
-
45
-
46
-
47
-
48
-
49
-
50
-
51
-
52
-
53
-
54
-
55
-
56
-
57
-
58
-
59
-
60
-
61
-
62
-
63
-
64
-
65
-
66
-
67
-
68
-
69
-
70
-
71
-
72
-
73
-
74
-
75
-
76
-
77
-
78
-
79
-
80
-
81
-
82
-
83
-
84
-
85
-
86
-
87
-
88
-
89
-
90
-
91
-
92
-
93
-
94
-
95
-
96
-
97
-
98
-
99
-
100
-
101
-
102
-
103
-
104
-
105
-
106
-
107
-
108
-
109
-
110
-
111
-
112
 |
 |

(a)
On July 6, 2015, Dollar Tree acquired Family Dollar Stores, Inc. The results of operations for Family Dollar are included in Dollar Tree’s results of operations
beginning on July 6, 2015..
(b)
The 2014 results include interest and expense totalling $75.2 million related to the acquisition of Family Dollar Stores, Inc. The impact of these expenses
represented $0.22 per diluted share.
(c)
The 2012 results include the impact of a 53rd week, commensurate with the retail calendar, and a gain on the sale of our investment in Ollie’s Holdings, Inc.
The extra week contributed $125 million of revenue and $0.08 diluted earnings per share. The gain on the Ollie’s sale amounted to $0.16 diluted earnings
per share. All other fi scal years reported in the table contain 52 weeks.
(d) Refl ects 2-for-1 stock split in June 2012.
(e) Comparable store net sales compare net store sales for stores open throughout each of the two periods being compared. Net sales per store are calculated for
stores open throughout the entire period presented.
(f) Family Dollar was not included in the determination of these items.
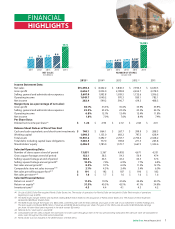
FINANCIAL
HIGHLIGHTS
2011 2012 2013 2014 2015
NUMBER OF STORES
(at year-end)
4,351 4,671 4,992 5,367
13,851
2015(a) 2014(b) 2013 2012 (c) 2011
Income Statement Data:
Net sales $15,498.4 $ 8,602.2 $ 7,840.3 $ 7,394.5 $ 6,630.5
Gross pro t 4,656.7 3,034.0 2,789.8 2,652.7 2,378.3
Selling, general and administrative expenses 3,607.0 1,993.8 1,819.5 1,732.6 1,596.2
Operating income 1,049.7 1,040.2 970.3 920.1 782.1
Net income 282.4 599.2 596.7 619.3 488.3
Margin Data (as a percentage of net sales):
Gross pro t 30.1% 35.3% 35.6% 35.9% 35.9%
Selling, general and administrative expenses 23.3% 23.2% 23.2% 23.5% 24.1%
Operating income 6.8% 12.1% 12.4% 12.4% 11.8%
Net income 1.8% 7.0 % 7.6% 8.4% 7.4%
Per Share Data:
Diluted net income per share(d) $ 1.26 $ 2.90 $ 2.72 $ 2.68 $ 2.01
Balance Sheet Data as of Fiscal Year End:
Cash and cash equivalents and short-term investments $ 740.1 $ 864.1 $ 267.7 $ 399.9 $ 288.3
Working capital 1,840.5 1,133.0 692.2 797.3 628.4
Total assets 15,901.2 3,492.7 2,767.7 2,750.4 2,328.2
Total debt, including capital lease obligations 7,465. 5 757.0 769.8 271.3 265.8
Shareholders’ equity 4,406.9 1,785.0 1,170.7 1,667.3 1,344.6
Selected Operating Data:
Number of stores open at end of period 13,851 5,367 4,992 4,671 4,351
Gross square footage at end of period 132.1 58.3 54.3 50.9 47.4
Selling square footage at end of period 108.4 46.5 43.2 40.5 37.6
Selling square footage annual growth(f) 10.3% 7.4% 6.9 % 7.7% 6.9%
Net sales annual growth(f) 8.5% 9.7% 6.0% 11.5% 12.7%
Comparable store net sales increase(e) (f) 2.1% 4.3% 2.4% 3.4% 6.0%
Net sales per selling square foot(e) (f) $ 191 $ 192 $ 187 $ 190 $ 182
Net sales per store(e) (f) $ 1.6 $ 1.7 $ 1.6 $ 1.6 $ 1.6
Selected Financial Ratios:
Return on assets(f) 11.4% 19.1% 21.6% 24.4% 20.7%
Return on equity(f) 31.5% 40.5% 42.1% 41.1% 34.8%
Inventory turns(f) 4.5 4.4 4.1 4.3 4.2
Dollar Tree Annual Report 2015 1
2011 2012 2013 2014 2015
NET SALES
($ in Billions)
6.6 7.4 7.8 8.6
15.5