Dollar Tree 2015 Annual Report Download - page 63
Download and view the complete annual report
Please find page 63 of the 2015 Dollar Tree annual report below. You can navigate through the pages in the report by either clicking on the pages listed below, or by using the keyword search tool below to find specific information within the annual report.-
 1
1 -
2
-
3
-
4
-
5
-
6
-
7
-
8
-
9
-
10
-
11
-
12
-
13
-
14
-
15
-
16
-
17
-
18
-
19
-
20
-
21
-
22
-
23
-
24
-
25
-
26
-
27
-
28
-
29
-
30
-
31
-
32
-
33
-
34
-
35
-
36
-
37
-
38
-
39
-
40
-
41
-
42
-
43
-
44
-
45
-
46
-
47
-
48
-
49
-
50
-
51
-
52
-
 53
53 -
 54
54 -
 55
55 -
 56
56 -
 57
57 -
 58
58 -
 59
59 -
 60
60 -
 61
61 -
 62
62 -
 63
63 -
 64
64 -
 65
65 -
 66
66 -
 67
67 -
 68
68 -
 69
69 -
 70
70 -
 71
71 -
 72
72 -
 73
73 -
74
-
75
-
76
-
77
-
78
-
79
-
80
-
81
-
82
-
83
-
84
-
85
-
86
-
87
-
88
-
89
-
90
-
91
-
92
-
93
-
94
-
95
-
96
-
97
-
98
-
99
-
100
-
101
-
102
-
103
-
104
-
105
-
106
-
107
-
108
-
109
-
110
-
111
-
112
 |
 |

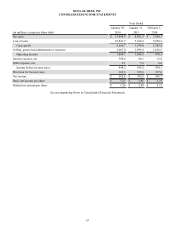
DOLLAR TREE, INC.
CONSOLIDATED STATEMENTS OF CASH FLOWS
Year Ended
January 30, January 31, February 1,
(in millions) 2016 2015 2014
Cash flows from operating activities:
Net income $ 282.4 $ 599.2 $ 596.7
Adjustments to reconcile net income to net cash provided by operating activities:
Depreciation and amortization 487.6 205.9 190.5
Provision for deferred income taxes 25.6 (18.1) 6.7
Stock-based compensation expense 53.2 38.3 37.0
Amortization of debt discount and debt issuance costs 64.7 — —
Other non-cash adjustments to net income 7.7 4.3 4.6
Changes in assets and liabilities increasing (decreasing) cash and cash equivalents:
Merchandise inventories (87.8) (6.0) (67.7)
Prepaids and other current assets (63.5) (12.2) 26.1
Accounts payable 183.9 41.9 46.9
Income taxes payable 3.1 (4.6) (32.3)
Other current liabilities (164.1) 87.5 (2.9)
Other liabilities (11.9) (9.4) (11.5)
Net cash provided by operating activities 780.9 926.8 794.1
Cash flows from investing activities:
Capital expenditures (480.5) (325.6) (330.1)
Acquisition of Family Dollar, net of common stock issued, equity compensation and
cash acquired (6,527.7) — —
Purchase of restricted cash and investments (23.7) (6.8) (8.8)
Proceeds from sale of restricted investments 53.0 15.8 15.0
Proceeds from (payments for) fixed asset disposition 0.5 1.6 (0.8)
Acquisition of favorable lease rights — — (0.3)
Net cash used in investing activities (6,978.4) (315.0) (325.0)
Cash flows from financing activities:
Principal payments for long-term debt (5,926.7) (12.8) (271.5)
Proceeds from long-term debt, net of discount 12,130.2 — 770.0
Debt-issuance costs (159.8) (11.8) —
Payments for share repurchases — — (1,112.1)
Proceeds from stock issued pursuant to stock-based
compensation plans 13.9 5.5 6.0
Tax benefit of exercises/vesting of equity-based compensation 12.8 4.5 9.8
Net cash provided by (used in) financing activities 6,070.4 (14.6) (597.8)
Effect of exchange rate changes on cash and cash equivalents (0.9) (0.8) (3.5)
Net increase (decrease) in cash and cash equivalents (128.0) 596.4 (132.2)
Cash and cash equivalents at beginning of year 864.1 267.7 399.9
Cash and cash equivalents at end of year $ 736.1 $ 864.1 $ 267.7
Supplemental disclosure of cash flow information:
Cash paid for:
Interest, net of amounts capitalized $ 487.0 $ 33.9 $ 14.5
Income taxes $ 138.4 $ 372.3 $ 373.2
Non-cash transactions:
Accrued capital expenditures $ 72.4 $ 19.7 $ 12.0
Acquisition cost paid in common stock and equity compensation $ 2,290.1 $ — $ —
See accompanying Notes to Consolidated Financial Statements
47