Dollar Tree 2015 Annual Report Download - page 26
Download and view the complete annual report
Please find page 26 of the 2015 Dollar Tree annual report below. You can navigate through the pages in the report by either clicking on the pages listed below, or by using the keyword search tool below to find specific information within the annual report.-
 1
1 -
2
-
3
-
4
-
5
-
6
-
7
-
8
-
9
-
10
-
11
-
12
-
13
-
14
-
15
-
 16
16 -
 17
17 -
 18
18 -
 19
19 -
 20
20 -
 21
21 -
 22
22 -
 23
23 -
 24
24 -
 25
25 -
 26
26 -
 27
27 -
 28
28 -
 29
29 -
 30
30 -
 31
31 -
 32
32 -
 33
33 -
 34
34 -
 35
35 -
 36
36 -
37
-
38
-
39
-
40
-
41
-
42
-
43
-
44
-
45
-
46
-
47
-
48
-
49
-
50
-
51
-
52
-
53
-
54
-
55
-
56
-
57
-
58
-
59
-
60
-
61
-
62
-
63
-
64
-
65
-
66
-
67
-
68
-
69
-
70
-
71
-
72
-
73
-
74
-
75
-
76
-
77
-
78
-
79
-
80
-
81
-
82
-
83
-
84
-
85
-
86
-
87
-
88
-
89
-
90
-
91
-
92
-
93
-
94
-
95
-
96
-
97
-
98
-
99
-
100
-
101
-
102
-
103
-
104
-
105
-
106
-
107
-
108
-
109
-
110
-
111
-
112
 |
 |

10
and shops at our stores like every customer, and ideas and individual creativity on the part of our associates are encouraged,
particularly from our store managers who know their stores and their customers. We have standards for store displays,
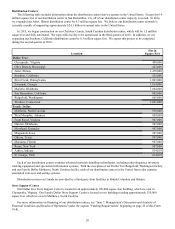
merchandise presentation, and store operations. We maintain an open door policy for all associates. Our distribution centers
are operated based on objective measures of performance and virtually everyone in our store support centers is available to
assist associates in the stores and distribution centers.
Our disclosure committee meets at least quarterly and monitors our internal controls over financial reporting to ensure that
our public filings contain discussions about the risks our business faces. We believe that we have the controls in place to be
able to certify our financial statements. Additionally, we have complied with the listing requirements for the Nasdaq Stock
Market.
Seasonality. For information on the impact of seasonality, see "Item 1A. Risk Factors" beginning on page 12 of this Form
10-K and "Item 7. Management's Discussion and Analysis of Financial Condition and Results of Operations" beginning on
page 26 of this Form 10-K.
Growth Strategy
Store Openings and Square Footage Growth. The primary factors contributing to our net sales growth have been new store
openings, an active store expansion and remodel program, and selective mergers and acquisitions. In the last five years, net
sales increased at a compound annual growth rate of 23.6%, including the addition of Family Dollar. We expect that the
majority of our future sales growth will come primarily from new store openings in our Dollar Tree and Family Dollar banners
and from our store expansion and relocation program.
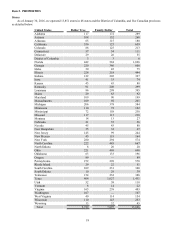
At January 28, 2012, we operated 4,351 stores in the United States and Canada. At January 30, 2016, we operated 13,626
stores in 48 states and the District of Columbia, as well as 225 stores in Canada. Our selling square footage increased from
approximately 37.6 million square feet in January 2012 to 108.4 million square feet in January 2016. Our store growth has
resulted from opening new stores and our July 2015 acquisition of more than 8,200 Family Dollar stores.
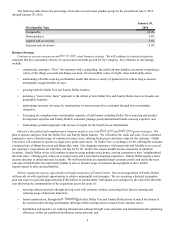
The following table shows the average selling square footage of our stores and the selling square footage per new store
opened over the last five years. Our growth and productivity statistics are reported based on selling square footage because our
management believes the use of selling square footage yields a more accurate measure of store productivity.
Year Number of Stores Average Selling Square
Footage Per Store
Average Selling Square
Footage Per New Store
Opened
2011 4,351 8,640 8,360
2012 4,671 8,660 8,060
2013 4,992 8,660 8,020
2014 5,367 8,660 8,060
2015 13,851 7,820 7,730
We expect to increase the selling square footage in our stores in the future by opening new stores in underserved markets
and strategically increasing our presence in our existing markets via new store openings and store expansions (expansions
include store relocations). In fiscal 2016 and beyond, we plan to predominantly open Dollar Tree stores that are approximately
8,000 - 10,000 selling square feet and Family Dollar stores that are approximately 6,000 - 8,000 selling square feet. We believe
these store sizes allow us to achieve our objectives in the markets in which we plan to expand.
In addition to new store openings, we plan to continue our Dollar Tree store expansion program to increase our net sales
per store and take advantage of market opportunities. We target stores for expansion based on the current sales per selling
square foot and changes in market opportunities. Stores targeted for expansion are generally less than 6,000 selling square feet
in size. Store expansions generally increase the existing store size by approximately 2,750 selling square feet. At January 30,
2016, approximately 3,243 of our Dollar Tree stores, totaling 63% of our Dollar Tree banner selling square footage, were 8,000
selling square feet or larger.
Since 1995, we have added a total of 695 stores through several mergers and acquisitions, excluding our acquisition of
Family Dollar. Our acquisition strategy has been to target companies that have a similar single-price point concept that have
shown success in operations or companies that provide a strategic advantage. We evaluate potential acquisition opportunities
as they become available. On July 6, 2015, we completed our acquisition of Family Dollar which allowed us to create a
diversified company with complementary business models. See "Note 2 - Acquisition" in "Item 8. Financial Statements and
Supplementary Data” beginning on page 53 of this Form 10-K.