Dollar Tree 2015 Annual Report Download - page 46
Download and view the complete annual report
Please find page 46 of the 2015 Dollar Tree annual report below. You can navigate through the pages in the report by either clicking on the pages listed below, or by using the keyword search tool below to find specific information within the annual report.-
 1
1 -
2
-
3
-
4
-
5
-
6
-
7
-
8
-
9
-
10
-
11
-
12
-
13
-
14
-
15
-
16
-
17
-
18
-
19
-
20
-
21
-
22
-
23
-
24
-
25
-
26
-
27
-
28
-
29
-
30
-
31
-
32
-
33
-
34
-
35
-
 36
36 -
 37
37 -
 38
38 -
 39
39 -
 40
40 -
 41
41 -
 42
42 -
 43
43 -
 44
44 -
 45
45 -
 46
46 -
 47
47 -
 48
48 -
 49
49 -
 50
50 -
 51
51 -
 52
52 -
 53
53 -
 54
54 -
 55
55 -
 56
56 -
57
-
58
-
59
-
60
-
61
-
62
-
63
-
64
-
65
-
66
-
67
-
68
-
69
-
70
-
71
-
72
-
73
-
74
-
75
-
76
-
77
-
78
-
79
-
80
-
81
-
82
-
83
-
84
-
85
-
86
-
87
-
88
-
89
-
90
-
91
-
92
-
93
-
94
-
95
-
96
-
97
-
98
-
99
-
100
-
101
-
102
-
103
-
104
-
105
-
106
-
107
-
108
-
109
-
110
-
111
-
112
 |
 |
30
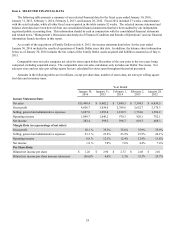
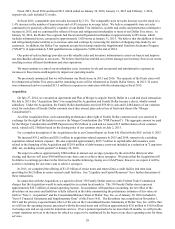
Income taxes. Our effective tax rate was 37.0% in 2015 compared to 37.2% in 2014. The rate decrease is due to the
utilization of a capital loss to offset the previously recognized gain on our investment in Ollie's Holdings, Inc. and additional
work opportunity tax credits partially offset by an increase in the valuation allowance.
Fiscal year ended January 31, 2015 compared to fiscal year ended February 1, 2014
Net sales. Net sales increased 9.7%, or $761.9 million, in 2014 compared to 2013, resulting from sales in our new stores
and a 4.3% increase in comparable store net sales. Comparable store net sales are positively affected by our expanded and
relocated stores, which we include in the calculation, and, to a lesser extent, are negatively affected when we open new stores
or expand stores near existing ones.
Gross profit. Gross profit margin was 35.3% in 2014 compared to 35.6% in 2013 due to increased freight costs partially
offset by leverage in occupancy costs from the higher comparable store sales increase.
Selling, general and administrative expenses. Selling, general and administrative expenses, as a percentage of net sales,
remained at 23.2% for 2014 compared to 2013. Excluding $28.5 million or approximately 35 basis points of expenses related
to the Family Dollar acquisition, the selling, general and administrative rate was 22.9%. The decrease is primarily due to lower
store payroll, health insurance and workers' compensation costs.
Operating income. Operating income margin was 12.1% in 2014 compared to 12.4% in 2013. Excluding the
approximately 35 basis points of acquisition-related expenses, operating income margin was 12.4% in 2014 as lower selling,
general and administrative expenses as a percentage of sales were offset by lower gross profit margin for the reasons noted
above.
Interest expense, net. Interest expense, net increased $64.7 million due to $46.7 million of commitment fees related to the
financing of the Family Dollar acquisition and a full year of interest expense on the $750.0 million of senior notes issued in
September 2013.
Other expense, net. Other expense, net in 2014 increased $5.3 million primarily due to unfavorable fair market value
adjustments for our diesel fuel hedges.
Income taxes. Our effective tax rate was 37.2% in 2014 compared to 37.5% in 2013. The rate decrease is the result of
lower state tax rates and additional work opportunity tax credits in 2014.
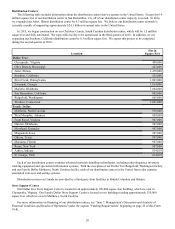
Segment Information
We operate a chain of more than 13,800 retail discount stores in 48 states and five Canadian provinces. Our operations are
conducted in two reporting business segments: Dollar Tree and Family Dollar. We define our segments as those operations
whose results our chief operating decision maker ("CODM") regularly reviews to analyze performance and allocate resources.
The Dollar Tree segment is the leading operator of discount variety stores offering merchandise at the fixed price of $1.00.
The Dollar Tree segment includes our operations under the "Dollar Tree," "Dollar Tree Canada," "Deals" and "Dollar Tree
Deals" brands, ten distribution centers in the United States and two in Canada and a Store Support Center in Chesapeake,
Virginia.
The Family Dollar segment operates a chain of general merchandise retail discount stores providing consumers with a
selection of competitively priced merchandise in convenient neighborhood stores. The Family Dollar segment consists of our
operations under the "Family Dollar" brand, eleven distribution centers and a Store Support Center in Matthews, North
Carolina.
We measure the results of our segments using, among other measures, each segment's net sales, gross profit and operating
income (loss). We may revise the measurement of each segment's operating income, including the allocation of distribution
center and Store Support Center costs, as determined by the information regularly reviewed by the CODM. When the
measurement of a segment changes, previous period amounts and balances are reclassified to be comparable to the current
period's presentation.
Because the Acquisition occurred in the fiscal year ended January 30, 2016, comparable information for the Family Dollar
segment is not provided. In addition, results for the fiscal year ended January 31, 2015 and the fiscal year ended February 1,
2014 only include the Dollar Tree segment; therefore, comparative information for these periods, which is included above, is
not provided in this discussion.