Dollar Tree 2015 Annual Report Download - page 41
Download and view the complete annual report
Please find page 41 of the 2015 Dollar Tree annual report below. You can navigate through the pages in the report by either clicking on the pages listed below, or by using the keyword search tool below to find specific information within the annual report.-
 1
1 -
2
-
3
-
4
-
5
-
6
-
7
-
8
-
9
-
10
-
11
-
12
-
13
-
14
-
15
-
16
-
17
-
18
-
19
-
20
-
21
-
22
-
23
-
24
-
25
-
26
-
27
-
28
-
29
-
30
-
 31
31 -
 32
32 -
 33
33 -
 34
34 -
 35
35 -
 36
36 -
 37
37 -
 38
38 -
 39
39 -
 40
40 -
 41
41 -
 42
42 -
 43
43 -
 44
44 -
 45
45 -
 46
46 -
 47
47 -
 48
48 -
 49
49 -
 50
50 -
 51
51 -
52
-
53
-
54
-
55
-
56
-
57
-
58
-
59
-
60
-
61
-
62
-
63
-
64
-
65
-
66
-
67
-
68
-
69
-
70
-
71
-
72
-
73
-
74
-
75
-
76
-
77
-
78
-
79
-
80
-
81
-
82
-
83
-
84
-
85
-
86
-
87
-
88
-
89
-
90
-
91
-
92
-
93
-
94
-
95
-
96
-
97
-
98
-
99
-
100
-
101
-
102
-
103
-
104
-
105
-
106
-
107
-
108
-
109
-
110
-
111
-
112
 |
 |
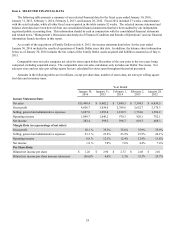
25
As of
January 30,
2016 January 31,
2015 February 1,
2014 February 2,
2013 January 28,
2012
Balance Sheet Data:
Cash and cash equivalents
and short-term investments $ 740.1 $ 864.1 $ 267.7 $ 399.9 $ 288.3
Working capital 1,840.5 1,133.0 692.2 797.3 628.4
Total assets 15,901.2 3,492.7 2,767.7 2,750.4 2,328.2
Total debt, including capital lease obligations 7,465.5 757.0 769.8 271.3 265.8
Shareholders' equity 4,406.9 1,785.0 1,170.7 1,667.3 1,344.6
Year Ended
January 30,
2016 January 31,
2015 February 1,
2014 February 2,
2013 January 28,
2012
Selected Operating Data:
Number of stores open at end of period 13,851 5,367 4,992 4,671 4,351
Dollar Tree 5,954 5,367 4,992 4,671 4,351
Family Dollar 7,897 — — — —
Gross square footage at end of period 132.1 58.3 54.3 50.9 47.4
Dollar Tree 64.2 58.3 54.3 50.9 47.4
Family Dollar 67.9 — — — —
Selling square footage at end of period 108.4 46.5 43.2 40.5 37.6
Dollar Tree 51.3 46.5 43.2 40.5 37.6
Family Dollar 57.1 — — — —
Selling square footage annual growth(1) 10.3% 7.4% 6.9% 7.7% 6.9%
Net sales annual growth(1) 8.5% 9.7% 6.0% 11.5% 12.7%
Comparable store net sales increase(1) 2.1% 4.3% 2.4% 3.4% 6.0%
Net sales per selling square foot(1) $ 191 $ 192 $ 187 $ 190 $ 182
Net sales per store(1) $ 1.6 $ 1.7 $ 1.6 $ 1.6 $ 1.6
Selected Financial Ratios:
Return on assets(1) 11.4% 19.1% 21.6% 24.4% 20.7%
Return on equity(1) 31.5% 40.5% 42.1% 41.1% 34.8%
Inventory turns(1) 4.5 4.4 4.1 4.3 4.2
(1) Family Dollar was not included in the determination of these items