Dollar Tree 2015 Annual Report Download - page 40
Download and view the complete annual report
Please find page 40 of the 2015 Dollar Tree annual report below. You can navigate through the pages in the report by either clicking on the pages listed below, or by using the keyword search tool below to find specific information within the annual report.-
 1
1 -
2
-
3
-
4
-
5
-
6
-
7
-
8
-
9
-
10
-
11
-
12
-
13
-
14
-
15
-
16
-
17
-
18
-
19
-
20
-
21
-
22
-
23
-
24
-
25
-
26
-
27
-
28
-
29
-
 30
30 -
 31
31 -
 32
32 -
 33
33 -
 34
34 -
 35
35 -
 36
36 -
 37
37 -
 38
38 -
 39
39 -
 40
40 -
 41
41 -
 42
42 -
 43
43 -
 44
44 -
 45
45 -
 46
46 -
 47
47 -
 48
48 -
 49
49 -
 50
50 -
51
-
52
-
53
-
54
-
55
-
56
-
57
-
58
-
59
-
60
-
61
-
62
-
63
-
64
-
65
-
66
-
67
-
68
-
69
-
70
-
71
-
72
-
73
-
74
-
75
-
76
-
77
-
78
-
79
-
80
-
81
-
82
-
83
-
84
-
85
-
86
-
87
-
88
-
89
-
90
-
91
-
92
-
93
-
94
-
95
-
96
-
97
-
98
-
99
-
100
-
101
-
102
-
103
-
104
-
105
-
106
-
107
-
108
-
109
-
110
-
111
-
112
 |
 |
24
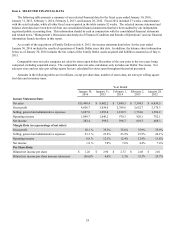
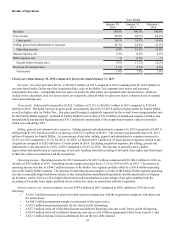
Item 6. SELECTED FINANCIAL DATA
The following table presents a summary of our selected financial data for the fiscal years ended January 30, 2016,
January 31, 2015, February 1, 2014, February 2, 2013, and January 28, 2012. Fiscal 2012 included 53 weeks, commensurate
with the retail calendar, while all other fiscal years reported in the table contain 52 weeks. The selected income statement and
balance sheet data have been derived from our consolidated financial statements that have been audited by our independent
registered public accounting firm. This information should be read in conjunction with the consolidated financial statements
and related notes, "Management’s Discussion and Analysis of Financial Condition and Results of Operations" and our financial
information found elsewhere in this report.
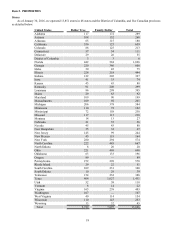
As a result of the acquisition of Family Dollar on July 6, 2015, the income statement data below for the year ended
January 30, 2016 includes the results of operations of Family Dollar since that date. In addition, the balance sheet information
below as of January 30, 2016 includes the fair values of the Family Dollar assets acquired and liabilities assumed as of July 6,
2015.
Comparable store net sales compares net sales for stores open before December of the year prior to the two years being
compared, including expanded stores. The comparable store net sales calculation only includes our Dollar Tree stores. Net
sales per store and net sales per selling square foot are calculated for stores open throughout the period presented.
Amounts in the following tables are in millions, except per share data, number of stores data, net sales per selling square
foot data and inventory turns.
Year Ended
January 30,
2016 January 31,
2015 February 1,
2014 February 2,
2013 January 28,
2012
Income Statement Data:
Net sales $15,498.4 $ 8,602.2 $ 7,840.3 $ 7,394.5 $ 6,630.5
Gross profit 4,656.7 3,034.0 2,789.8 2,652.7 2,378.3
Selling, general and administrative expenses 3,607.0 1,993.8 1,819.5 1,732.6 1,596.2
Operating income 1,049.7 1,040.2 970.3 920.1 782.1
Net income 282.4 599.2 596.7 619.3 488.3
Margin Data (as a percentage of net sales):
Gross profit 30.1 % 35.3% 35.6% 35.9% 35.9%
Selling, general and administrative expenses 23.3 % 23.2% 23.2% 23.5% 24.1%
Operating income 6.8 % 12.1% 12.4% 12.4% 11.8%
Net income 1.8 % 7.0% 7.6% 8.4% 7.4%
Per Share Data:
Diluted net income per share $ 1.26 $ 2.90 $ 2.72 $ 2.68 $ 2.01
Diluted net income per share increase (decrease) (56.6)% 6.6% 1.5% 33.3% 29.7%