Dollar Tree 2015 Annual Report Download - page 59
Download and view the complete annual report
Please find page 59 of the 2015 Dollar Tree annual report below. You can navigate through the pages in the report by either clicking on the pages listed below, or by using the keyword search tool below to find specific information within the annual report.-
 1
1 -
2
-
3
-
4
-
5
-
6
-
7
-
8
-
9
-
10
-
11
-
12
-
13
-
14
-
15
-
16
-
17
-
18
-
19
-
20
-
21
-
22
-
23
-
24
-
25
-
26
-
27
-
28
-
29
-
30
-
31
-
32
-
33
-
34
-
35
-
36
-
37
-
38
-
39
-
40
-
41
-
42
-
43
-
44
-
45
-
46
-
47
-
48
-
 49
49 -
 50
50 -
 51
51 -
 52
52 -
 53
53 -
 54
54 -
 55
55 -
 56
56 -
 57
57 -
 58
58 -
 59
59 -
 60
60 -
 61
61 -
 62
62 -
 63
63 -
 64
64 -
 65
65 -
 66
66 -
 67
67 -
 68
68 -
 69
69 -
70
-
71
-
72
-
73
-
74
-
75
-
76
-
77
-
78
-
79
-
80
-
81
-
82
-
83
-
84
-
85
-
86
-
87
-
88
-
89
-
90
-
91
-
92
-
93
-
94
-
95
-
96
-
97
-
98
-
99
-
100
-
101
-
102
-
103
-
104
-
105
-
106
-
107
-
108
-
109
-
110
-
111
-
112
 |
 |

43
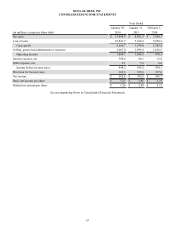
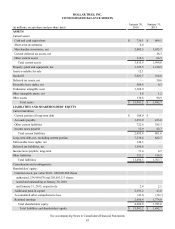
DOLLAR TREE, INC.
CONSOLIDATED INCOME STATEMENTS
Year Ended
January 30, January 31, February 1,
(in millions, except per share data) 2016 2015 2014
Net sales $ 15,498.4 $ 8,602.2 $ 7,840.3
Cost of sales 10,841.7 5,568.2 5,050.5
Gross profit 4,656.7 3,034.0 2,789.8
Selling, general and administrative expenses 3,607.0 1,993.8 1,819.5
Operating income 1,049.7 1,040.2 970.3
Interest expense, net 599.4 80.1 15.4
Other expense, net 2.1 5.9 0.6
Income before income taxes 448.2 954.2 954.3
Provision for income taxes 165.8 355.0 357.6
Net income $ 282.4 $ 599.2 $ 596.7
Basic net income per share $ 1.27 $ 2.91 $ 2.74
Diluted net income per share $ 1.26 $ 2.90 $ 2.72
See accompanying Notes to Consolidated Financial Statements