Dollar Tree 2015 Annual Report Download - page 45
Download and view the complete annual report
Please find page 45 of the 2015 Dollar Tree annual report below. You can navigate through the pages in the report by either clicking on the pages listed below, or by using the keyword search tool below to find specific information within the annual report.-
 1
1 -
2
-
3
-
4
-
5
-
6
-
7
-
8
-
9
-
10
-
11
-
12
-
13
-
14
-
15
-
16
-
17
-
18
-
19
-
20
-
21
-
22
-
23
-
24
-
25
-
26
-
27
-
28
-
29
-
30
-
31
-
32
-
33
-
34
-
 35
35 -
 36
36 -
 37
37 -
 38
38 -
 39
39 -
 40
40 -
 41
41 -
 42
42 -
 43
43 -
 44
44 -
 45
45 -
 46
46 -
 47
47 -
 48
48 -
 49
49 -
 50
50 -
 51
51 -
 52
52 -
 53
53 -
 54
54 -
 55
55 -
56
-
57
-
58
-
59
-
60
-
61
-
62
-
63
-
64
-
65
-
66
-
67
-
68
-
69
-
70
-
71
-
72
-
73
-
74
-
75
-
76
-
77
-
78
-
79
-
80
-
81
-
82
-
83
-
84
-
85
-
86
-
87
-
88
-
89
-
90
-
91
-
92
-
93
-
94
-
95
-
96
-
97
-
98
-
99
-
100
-
101
-
102
-
103
-
104
-
105
-
106
-
107
-
108
-
109
-
110
-
111
-
112
 |
 |

29
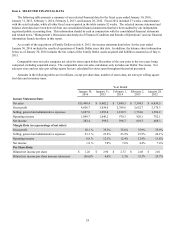
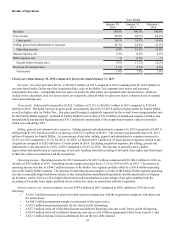
Results of Operations
Year Ended
January 30,
2016 January 31,
2015 February 1,
2014
Net sales 100.0% 100.0% 100.0%
Cost of sales 69.9% 64.7% 64.4%
Gross profit 30.1% 35.3% 35.6%
Selling, general and administrative expenses 23.3% 23.2% 23.2%
Operating income 6.8% 12.1% 12.4%
Interest expense, net 3.9% 0.9% 0.2%
Other expense, net —% 0.1% —%
Income before income taxes 2.9% 11.1% 12.2%
Provision for income taxes 1.1% 4.1% 4.6%
Net income 1.8% 7.0% 7.6%
Fiscal year ended January 30, 2016 compared to fiscal year ended January 31, 2015
Net sales. Net sales increased 80.2%, or $6,896.2 million, in 2015 compared to 2014, resulting from $6,162.0 million of
net sales from Family Dollar since the Acquisition Date, sales in the Dollar Tree segment's new stores and increased
comparable store sales. Comparable store net sales are positively affected by our expanded and relocated stores, which we
include in the calculation, and, to a lesser extent, are negatively affected when we open new stores, rebanner stores or expand
stores near existing ones.
Gross profit. Gross profit increased by $1,622.7 million, or 53.5%, to $4,656.7 million in 2015 compared to $3,034.0
million in 2014. The dollar increase in gross profit was primarily driven by $1,407.4 million of gross profit for Family Dollar
as well as higher sales for Dollar Tree. Our gross profit margin is negatively impacted by the overall lower-margin product mix
for the Family Dollar segment. Included in Family Dollar's cost of sales is $73.0 million of markdown expense related to sku
rationalization and planned liquidations and $70.2 million for amortization of the stepped-up inventory value for inventory
which was sold during 2015.
Selling, general and administrative expenses. Selling, general and administrative expenses for 2015 increased to $3,607.0
million from $1,993.8 million in 2014, an increase of $1,613.2 million or 80.9%. The increase was primarily due to $1,438.2
million of expense for Family Dollar. As a percentage of net sales, selling, general and administrative expenses increased to
23.3% for 2015 compared to 23.2% for 2014. In 2015, we incurred $39.1 million or 25 basis points of expenses related to the
Acquisition compared to $28.5 million or 35 basis points in 2014. Excluding acquisition expenses, the selling, general and
administrative rate increased to 23.0% in 2015 compared to 22.8% in 2014. The increase is primarily due to higher
depreciation and amortization as a percentage of net sales resulting from the recording of favorable lease rights and fixed assets
at their fair values in connection with the Acquisition.
Operating income. Operating income for 2015 increased to $1,049.7 million compared with $1,040.2 million in 2014, an
increase of $9.5 million or 0.9%. Operating income margin decreased from 12.1% in 2014 to 6.8% in 2015. The increase in
operating income was due to a $40.3 million increase in the Dollar Tree segment partially offset by a $30.8 million operating
loss in the Family Dollar segment. The decrease in operating income margin is a result of the Family Dollar segment operating
loss due to unusually high markdowns related to sku rationalization and planned liquidations and the amortization of stepped-
up inventory sold in 2015 as well as higher depreciation and amortization as a percentage of net sales resulting from the
recording of favorable lease rights and fixed assets at their fair values in connection with the Acquisition.
Interest expense, net. Interest expense, net was $599.4 million in 2015 compared to $80.1 million in 2014 due to the
following:
• A $161.9 million increase in interest for debt issued in conjunction with the Acquisition compared with interest on
the senior notes;
• An $89.5 million prepayment penalty on retirement of the senior notes;
• A $39.5 million prepayment penalty for the Term Loan B refinancing;
• A $27.3 million write-off of the debt discount and deferred financing costs due to the Term Loan B refinancing;
• A $19.0 million write-off of deferred financing costs due to a $1.0 billion prepayment of the Term Loan B-1; and
• A $12.1 million increase in loan commitment fees on the new debt structure.