Dollar Tree 2015 Annual Report Download - page 47
Download and view the complete annual report
Please find page 47 of the 2015 Dollar Tree annual report below. You can navigate through the pages in the report by either clicking on the pages listed below, or by using the keyword search tool below to find specific information within the annual report.-
 1
1 -
2
-
3
-
4
-
5
-
6
-
7
-
8
-
9
-
10
-
11
-
12
-
13
-
14
-
15
-
16
-
17
-
18
-
19
-
20
-
21
-
22
-
23
-
24
-
25
-
26
-
27
-
28
-
29
-
30
-
31
-
32
-
33
-
34
-
35
-
36
-
 37
37 -
 38
38 -
 39
39 -
 40
40 -
 41
41 -
 42
42 -
 43
43 -
 44
44 -
 45
45 -
 46
46 -
 47
47 -
 48
48 -
 49
49 -
 50
50 -
 51
51 -
 52
52 -
 53
53 -
 54
54 -
 55
55 -
 56
56 -
 57
57 -
58
-
59
-
60
-
61
-
62
-
63
-
64
-
65
-
66
-
67
-
68
-
69
-
70
-
71
-
72
-
73
-
74
-
75
-
76
-
77
-
78
-
79
-
80
-
81
-
82
-
83
-
84
-
85
-
86
-
87
-
88
-
89
-
90
-
91
-
92
-
93
-
94
-
95
-
96
-
97
-
98
-
99
-
100
-
101
-
102
-
103
-
104
-
105
-
106
-
107
-
108
-
109
-
110
-
111
-
112
 |
 |

31
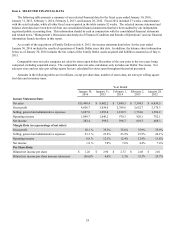
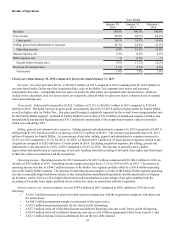
The following table summarizes the operating results of the Dollar Tree segment:
Year Ended
January 30, 2016 January 31, 2015
(in millions) $ % of Sales $ % of Sales
Net sales $ 9,336.4 $ 8,602.2
Gross profit 3,249.3 34.8% 3,034.0 35.3%
Operating income 1,080.5 11.6% 1,040.2 12.1%
Net sales for Dollar Tree increased 8.5% in 2015 compared to 2014 due to sales from new stores and a comparable store
sales increase of 2.5% on a constant currency basis.
Gross profit margin for Dollar Tree decreased to 34.8% in 2015 compared to 35.3% in 2014. The decrease in gross profit
margin was due to:
• higher distribution and occupancy costs as a percentage of net sales;
• higher shrink as a result of unfavorable physical inventory results; and
• higher markdowns due to Deals markdowns taken on multi-price inventory in preparation for their conversion to
Dollar Tree stores.
Operating income margin for Dollar Tree decreased to 11.6% in 2015 compared to 12.1% in 2014. Excluding acquisition
costs of $39.2 million or 40 basis points in 2015 and $28.5 million or 35 basis points in 2014, operating income margin was
12.0% and 12.4% in 2015 and 2014, respectively. Excluding acquisition costs, the decrease in operating income margin was
the result of lower gross profit margin as noted above and higher professional fees related to the Family Dollar integration
partially offset by lower payroll costs as a percentage of net sales due to lower profit sharing contributions.
Liquidity and Capital Resources
Our business requires capital to build and open new stores, expand our distribution network and operate and expand
existing stores. Our working capital requirements for existing stores are seasonal and usually reach their peak in September
and October. Historically, we have satisfied our seasonal working capital requirements for existing stores and have funded our
store opening and distribution network expansion programs from internally generated funds and borrowings under our credit
facilities.
The following table compares cash-flow related information for the years ended January 30, 2016, January 31, 2015 and
February 1, 2014:
Year Ended
January 30, January 31, February 1,
(in millions) 2016 2015 2014
Net cash provided by (used in):
Operating activities $ 780.9 $ 926.8 $ 794.1
Investing activities (6,978.4)(315.0)(325.0)
Financing activities 6,070.4 (14.6)(597.8)
Net cash provided by operating activities decreased $145.9 million in 2015 compared to 2014 due primarily to lower net
income, net of depreciation and amortization, an decrease in accrued expenditures related to the Family Dollar acquisition, an
increase in cash used to purchase merchandise inventories and an increase in accounts payable.
Net cash provided by operating activities increased $132.7 million in 2014 compared to 2013 due primarily to an increase
in accrued expenditures related to the Family Dollar acquisition and a decrease in cash used to purchase merchandise
inventories.
Net cash used in investing activities increased $6,663.4 million in 2015 compared with 2014 primarily due to the
acquisition of Family Dollar and higher capital expenditures.