ComEd 2003 Annual Report Download - page 86
Download and view the complete annual report
Please find page 86 of the 2003 ComEd annual report below. You can navigate through the pages in the report by either clicking on the pages listed below, or by using the keyword search tool below to find specific information within the annual report.-
 1
1 -
2
-
3
-
4
-
5
-
6
-
7
-
8
-
9
-
10
-
11
-
12
-
13
-
14
-
15
-
16
-
17
-
18
-
19
-
20
-
21
-
22
-
23
-
24
-
25
-
26
-
27
-
28
-
29
-
30
-
31
-
32
-
33
-
34
-
35
-
36
-
37
-
38
-
39
-
40
-
41
-
42
-
43
-
44
-
45
-
46
-
47
-
48
-
49
-
50
-
51
-
52
-
53
-
54
-
55
-
56
-
57
-
58
-
59
-
60
-
61
-
62
-
63
-
64
-
65
-
66
-
67
-
68
-
69
-
70
-
71
-
72
-
73
-
74
-
75
-
 76
76 -
 77
77 -
 78
78 -
 79
79 -
 80
80 -
 81
81 -
 82
82 -
 83
83 -
 84
84 -
 85
85 -
 86
86 -
 87
87 -
 88
88 -
 89
89 -
 90
90 -
 91
91 -
 92
92 -
 93
93 -
 94
94 -
 95
95 -
 96
96 -
97
-
98
-
99
-
100
-
101
-
102
-
103
-
104
-
105
-
106
-
107
-
108
-
109
-
110
-
111
-
112
-
113
-
114
-
115
-
116
-
117
-
118
-
119
-
120
-
121
-
122
-
123
-
124
-
125
-
126
-
127
-
128
-
129
-
130
-
131
-
132
-
133
-
134
-
135
-
136
-
137
-
138
 |
 |

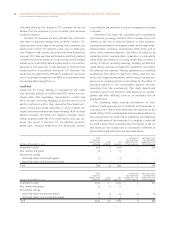
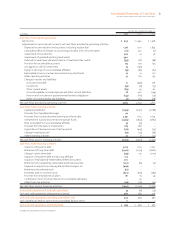
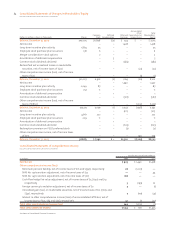
84 Consolidated Statements of Changes in Shareholders’ Equity
EXELON CORPORATION AND SUBSIDIARY COMPANIES
Dollars in millions, shares in thousands Shares
Common
Stock
Deferred
Compensation
Retained
Earnings
Accumulated
Other
Comprehensive
Income (Loss)
Total
Shareholders’
Equity
Balance, December 31, 2000 319,005 $6,898 $(7) $ 324 $ – $ 7,215
Net income – – 1,428 – 1,428
Long-term incentive plan activity 1,864 55 – – – 55
Employee stock purchase plan issuances 138 6 – – – 6
Merger consideration-stock options 2 – – – 2
Amortization of deferred compensation – 5 – – 5
Common stock dividends declared – – (583) – (583)
Reclassified net unrealized losses on marketable
securities, net of income taxes of $(22) – – – (23) (23)
Other comprehensive income (loss), net of income
taxes of $(7) – – – (3) (3)
Balance, December 31, 2001 321,007 6,961 (2) 1,169 (26) 8,102
Net income – – 1,440 – 1,440
Long-term incentive plan activity 2,049 87 – – – 87
Employee stock purchase plan issuances 257 11 – – – 11
Amortization of deferred compensation – 1 – – 1
Common stock dividends declared – – (567) – (567)
Other comprehensive income (loss), net of income
taxes of $(850) – – – (1,332) (1,332)
Balance, December 31, 2002 323,313 7,059 (1) 2,042 (1,358) 7,742
Net income – – 905 – 905
Long-term incentive plan activity 4,661 222 – – – 222
Employee stock purchase plan issuances 209 11 – – – 11
Amortization of deferred compensation – 1 – – 1
Common stock dividends declared – – (625) – (625)
Redemption premium on PECO preferred stock – – (2) – (2)
Other comprehensive income, net of income taxes
of $217 – – – 249 249
Balance, December 31, 2003 328,183 $ 7,292 $ – $2,320 $(1,109) $8,503
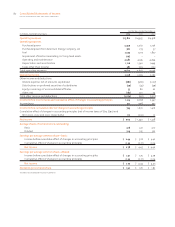
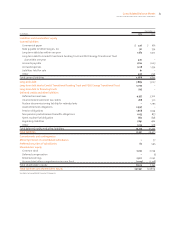
Consolidated Statements of Comprehensive Income
EXELON CORPORATION AND SUBSIDIARY COMPANIES
For the Years Ended December 31,
in millions 2003 2002 2001
Net income $ 905 $ 1,440 $1,428
Other comprehensive income (loss)
Minimum pension liability, net of income taxes of $16 and $(597), respectively 26 (1,007) —
SFAS No. 133 transition adjustment, net of income taxes of $32 ——44
SFAS No. 143 transition adjustment, net of income taxes of $167 168 ——
Cash-flow hedge fair value adjustment, net of income taxes of $3, $(132) and $17,
respectively 3(199) 22
Foreign currency translation adjustment, net of income taxes of $0 3— (1)
Unrealized gain (loss) on marketable securities, net of income taxes of $6, $(116), and
$(40), respectively 7(119) (41)
Interest in other comprehensive income (loss) of unconsolidated affiliates, net of
income taxes of $25, $(5) and $(16), respectively 42 (7) (27)
Total other comprehensive income (loss) 249 (1,332) (3)
Total comprehensive income $1,154 $ 108 $1,425
See Notes to Consolidated Financial Statements