ComEd 2003 Annual Report Download - page 117
Download and view the complete annual report
Please find page 117 of the 2003 ComEd annual report below. You can navigate through the pages in the report by either clicking on the pages listed below, or by using the keyword search tool below to find specific information within the annual report.-
 1
1 -
2
-
3
-
4
-
5
-
6
-
7
-
8
-
9
-
10
-
11
-
12
-
13
-
14
-
15
-
16
-
17
-
18
-
19
-
20
-
21
-
22
-
23
-
24
-
25
-
26
-
27
-
28
-
29
-
30
-
31
-
32
-
33
-
34
-
35
-
36
-
37
-
38
-
39
-
40
-
41
-
42
-
43
-
44
-
45
-
46
-
47
-
48
-
49
-
50
-
51
-
52
-
53
-
54
-
55
-
56
-
57
-
58
-
59
-
60
-
61
-
62
-
63
-
64
-
65
-
66
-
67
-
68
-
69
-
70
-
71
-
72
-
73
-
74
-
75
-
76
-
77
-
78
-
79
-
80
-
81
-
82
-
83
-
84
-
85
-
86
-
87
-
88
-
89
-
90
-
91
-
92
-
93
-
94
-
95
-
96
-
97
-
98
-
99
-
100
-
101
-
102
-
103
-
104
-
105
-
106
-
 107
107 -
 108
108 -
 109
109 -
 110
110 -
 111
111 -
 112
112 -
 113
113 -
 114
114 -
 115
115 -
 116
116 -
 117
117 -
 118
118 -
 119
119 -
 120
120 -
 121
121 -
 122
122 -
 123
123 -
 124
124 -
 125
125 -
 126
126 -
 127
127 -
128
-
129
-
130
-
131
-
132
-
133
-
134
-
135
-
136
-
137
-
138
 |
 |

115Notes to Consolidated Financial Statements
EXELON CORPORATION AND SUBSIDIARY COMPANIES
related to Enterprises’ mark-to-market contracts. Enter-
prises’ counterparties in these contracts are all investment
grade.
As of December 31, 2003, $176 million of deferred net
losses on derivative instruments in accumulated other com-
prehensive income are expected to be reclassified to earn-
ings during the next twelve months. Amounts in
accumulated other comprehensive income related to
changes in interest-rate cash-flow hedges are reclassified
into earnings when the forecasted interest payment occurs.
Amounts in accumulated other comprehensive income re-
lated to changes in energy commodity cash-flow hedges are
reclassified into earnings when the forecasted purchase or
sale of the energy commodity occurs. The majority of Ex-
elon’s cash-flow hedges are expected to settle within the
next 4 years.
Exelon would be exposed to credit-related losses in the
event of non-performance by the counterparties that issued
the derivative instruments. The credit exposure of de-
rivatives contracts is represented by the fair value of con-
tracts at the reporting date. Exelon’s interest-rate swaps are
documented under master agreements. Among other
things, these agreements provide for a maximum credit
exposure for both parties. Payments are required by the ap-
propriate party when the maximum limit is reached. Gen-
eration has entered into payment netting agreements or
enabling agreements that allow for payment netting with
the majority of its large counterparties, which reduce Gen-
eration’s exposure to counterparty risk by providing for the
offset of amounts payable to the counterparty against
amounts receivable from the counterparty.
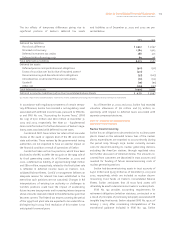
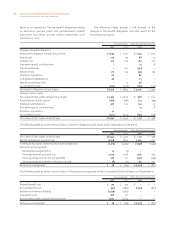
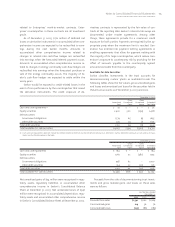
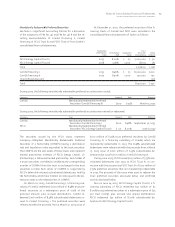
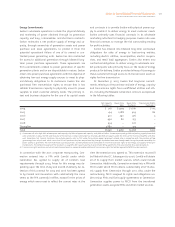
Available-for-Sale Securities
Exelon classifies investments in the trust accounts for
decommissioning nuclear plants as available-for-sale. The
following tables show the fair values, gross unrealized gains
and losses and amortized cost bases for the securities held in
these trust accounts as of December 31, 2003 and 2002.
December 31, 2003
Amortized
Cost
Gross
Unrealized
Gains
Gross
Unrealized
Losses
Estimated
Fair Value
Cash and cash equivalents(1) $72 $– $– $72
Equity securities 2,402 300 (294) 2,408
Debt securities
Government obligations 1,574 65 (4) 1,635
Other debt securities 579 29 (2) 606
Total debt securities 2,153 94 (6) 2,241
Total available-for-sale securities $4,627 $394 $(300) $ 4,721
(1) Cash and cash equivalents does not include $12 million related to AmerGen nuclear decommissioning trust. AmerGen’s nuclear decommissioning trust cash and cash equiv-
alents are classified elsewhere in the table.
December 31, 2002
Amortized
Cost
Gross
Unrealized
Gains
Gross
Unrealized
Losses
Estimated
Fair Value
Cash and cash equivalents $ 184 $ – $ – $ 184
Equity securities 1,763 72 (482) 1,353
Debt securities
Government obligations 938 62 – 1,000
Other debt securities 514 32 (30) 516
Total debt securities 1,452 94 (30) 1,516
Total available-for-sale securities $3,399 $166 $ (512) $ 3,053
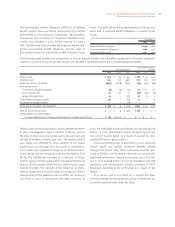
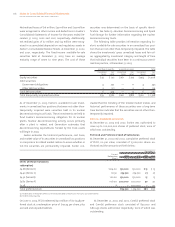
Net unrealized gains of $94 million were recognized in regu-
latory assets, regulatory liabilities or accumulated other
comprehensive income in Exelon’s Consolidated Balance
Sheet at December 31, 2003. Net unrealized losses of $346
million were recognized in accumulated depreciation, regu-
latory assets and accumulated other comprehensive income
in Exelon’s Consolidated Balance Sheet at December 31, 2002.
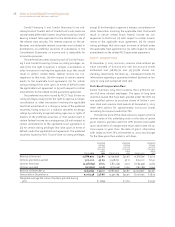
Proceeds from the sale of decommissioning trust invest-
ments and gross realized gains and losses on those sales
were as follows:
For the Years Ended
December 31,
2003 2002 2001
Proceeds from sales $2,341 $1,612 $1,624
Gross realized gains 219 56 76
Gross realized losses (235) (86) (189)