ComEd 2003 Annual Report Download - page 45
Download and view the complete annual report
Please find page 45 of the 2003 ComEd annual report below. You can navigate through the pages in the report by either clicking on the pages listed below, or by using the keyword search tool below to find specific information within the annual report.-
 1
1 -
2
-
3
-
4
-
5
-
6
-
7
-
8
-
9
-
10
-
11
-
12
-
13
-
14
-
15
-
16
-
17
-
18
-
19
-
20
-
21
-
22
-
23
-
24
-
25
-
26
-
27
-
28
-
29
-
30
-
31
-
32
-
33
-
34
-
 35
35 -
 36
36 -
 37
37 -
 38
38 -
 39
39 -
 40
40 -
 41
41 -
 42
42 -
 43
43 -
 44
44 -
 45
45 -
 46
46 -
 47
47 -
 48
48 -
 49
49 -
 50
50 -
 51
51 -
 52
52 -
 53
53 -
 54
54 -
 55
55 -
56
-
57
-
58
-
59
-
60
-
61
-
62
-
63
-
64
-
65
-
66
-
67
-
68
-
69
-
70
-
71
-
72
-
73
-
74
-
75
-
76
-
77
-
78
-
79
-
80
-
81
-
82
-
83
-
84
-
85
-
86
-
87
-
88
-
89
-
90
-
91
-
92
-
93
-
94
-
95
-
96
-
97
-
98
-
99
-
100
-
101
-
102
-
103
-
104
-
105
-
106
-
107
-
108
-
109
-
110
-
111
-
112
-
113
-
114
-
115
-
116
-
117
-
118
-
119
-
120
-
121
-
122
-
123
-
124
-
125
-
126
-
127
-
128
-
129
-
130
-
131
-
132
-
133
-
134
-
135
-
136
-
137
-
138
 |
 |

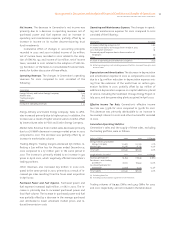
43Management’s Discussion and Analysis of Financial Condition and Results of Operations
EXELON CORPORATION AND SUBSIDIARY COMPANIES
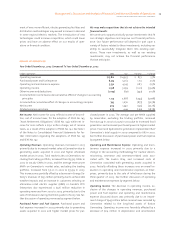
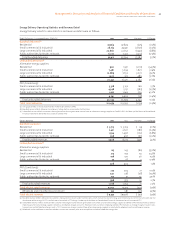
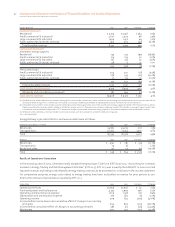
Energy Delivery Operating Statistics and Revenue Detail
Energy Delivery’s electric sales statistics and revenue detail were as follows:
Retail Deliveries—(in gigawatthours (GWhs))(a) 2003 2002 Variance % Change
Bundled deliveries(b)
Residential 37,564 37,839 (275) (0.7%)
Small commercial & industrial 28,165 29,971 (1,806) (6.0%)
Large commercial & industrial 20,660 22,652 (1,992) (8.8%)
Public authorities & electric railroads 6,022 7,332 (1,310) (17.9%)
Total bundled deliveries 92,411 97,794 (5,383) (5.5%)
Unbundled deliveries(c)
Alternative energy suppliers
Residential 900 1,971 (1,071) (54.3%)
Small commercial & industrial 7,461 5,634 1,827 32.4%
Large commercial & industrial 10,689 7,652 3,037 39.7%
Public authorities & electric railroads 1,402 913 489 53.6%
20,452 16,170 4,282 26.5%
PPO (ComEd only)
Small commercial & industrial 3,318 3,152 166 5.3%
Large commercial & industrial 4,348 5,131 (783) (15.3%)
Public authorities & electric railroads 1,925 1,346 579 43.0%
9,591 9,629 (38) (0.4%)
Total unbundled deliveries 30,043 25,799 4,244 16.5%
Total retail deliveries 122,454 123,593 (1,139) (0.9%)
(a) One gigawatthour is the equivalent of one million kilowatthours (kWh).
(b) Bundled service reflects deliveries to customers taking electric service under tariffed rates.
(c) Unbundled service reflects customers electing to receive electric generation service from an alternative energy supplier or ComEd’s PPO. See Note 4 of the Notes to Consolidated
Financial Statements for further discussion of ComEd’s PPO.
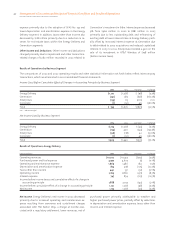
Electric Revenue 2003 2002 Variance % Change
Bundled revenues(a)
Residential $ 3,715 $ 3,719 $ (4) (0.1%)
Small commercial & industrial 2,421 2,601 (180) (6.9%)
Large commercial & industrial 1,394 1,496 (102) (6.8%)
Public authorities & electric railroads 396 456 (60) (13.2%)
Total bundled revenues 7,926 8,272 (346) (4.2%)
Unbundled revenues(b)
Alternative energy suppliers
Residential 65 145 (80) (55.2%)
Small commercial & industrial 214 159 55 34.6%
Large commercial & industrial 196 170 26 15.3%
Public authorities & electric railroads 33 28 5 17.9%
508 502 6 1.2%
PPO (ComEd only)
Small commercial & industrial 225 204 21 10.3%
Large commercial & industrial 240 278 (38) (13.7%)
Public authorities & electric railroads 103 71 32 45.1%
568 553 15 2.7%
Total unbundled revenues 1,076 1,055 21 2.0%
Total electric retail revenues 9,002 9,327 (325) (3.5%)
Wholesale and miscellaneous revenue(c) 555 581 (26) (4.5%)
Total electric revenue $ 9,557 $9,908 $ (351) (3.5%)
(a) Bundled revenue reflects deliveries to customers taking electric service under tariffed rates, which include the cost of energy and the delivery cost of the transmission and the
distribution of the energy. PECO’s tariffed rates also include a CTC charge. See Note 4 of the Notes to Consolidated Financial Statements for a discussion of CTC.
(b) Unbundled revenue reflects revenue from customers electing to receive electric generation service from an alternative energy supplier or ComEd’s PPO. Revenue from customers
choosing an alternative energy supplier includes a distribution charge and a CTC. Revenues from customers choosing ComEd’s PPO includes an energy charge at market rates,
transmission and distribution charges, and a CTC. Transmission charges received from alternative energy suppliers are included in wholesale and miscellaneous revenue.
(c) Wholesale and miscellaneous revenues include transmission revenue, sales to municipalities and other wholesale energy sales.