ComEd 2003 Annual Report Download - page 75
Download and view the complete annual report
Please find page 75 of the 2003 ComEd annual report below. You can navigate through the pages in the report by either clicking on the pages listed below, or by using the keyword search tool below to find specific information within the annual report.-
 1
1 -
2
-
3
-
4
-
5
-
6
-
7
-
8
-
9
-
10
-
11
-
12
-
13
-
14
-
15
-
16
-
17
-
18
-
19
-
20
-
21
-
22
-
23
-
24
-
25
-
26
-
27
-
28
-
29
-
30
-
31
-
32
-
33
-
34
-
35
-
36
-
37
-
38
-
39
-
40
-
41
-
42
-
43
-
44
-
45
-
46
-
47
-
48
-
49
-
50
-
51
-
52
-
53
-
54
-
55
-
56
-
57
-
58
-
59
-
60
-
61
-
62
-
63
-
64
-
 65
65 -
 66
66 -
 67
67 -
 68
68 -
 69
69 -
 70
70 -
 71
71 -
 72
72 -
 73
73 -
 74
74 -
 75
75 -
 76
76 -
 77
77 -
 78
78 -
 79
79 -
 80
80 -
 81
81 -
 82
82 -
 83
83 -
 84
84 -
 85
85 -
86
-
87
-
88
-
89
-
90
-
91
-
92
-
93
-
94
-
95
-
96
-
97
-
98
-
99
-
100
-
101
-
102
-
103
-
104
-
105
-
106
-
107
-
108
-
109
-
110
-
111
-
112
-
113
-
114
-
115
-
116
-
117
-
118
-
119
-
120
-
121
-
122
-
123
-
124
-
125
-
126
-
127
-
128
-
129
-
130
-
131
-
132
-
133
-
134
-
135
-
136
-
137
-
138
 |
 |

73Management’s Discussion and Analysis of Financial Condition and Results of Operations
EXELON CORPORATION AND SUBSIDIARY COMPANIES
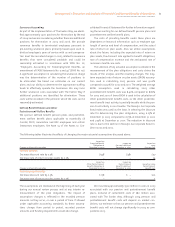
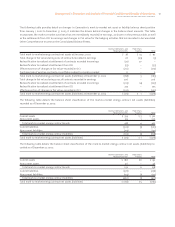
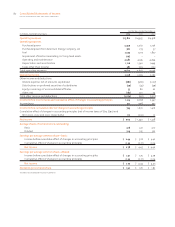
The table below provides details of effective cash-flow
hedges under SFAS No. 133 included in the balance sheet as
of December 31, 2003. The data in the table gives an in-
dication of the magnitude of SFAS No. 133 hedges Generation
has in place; however, since under SFAS No. 133 not all hedges
are recorded in OCI, the table does not provide an all-
encompassing picture of Generation’s hedges. The table also
includes a roll-forward of Accumulated Other Compre-
hensive Income related to cash-flow hedges for the years
ended December 31, 2003 and December 31, 2002, providing
insight into the drivers of the changes (new hedges entered
into during the period and changes in the value of existing
hedges). Information related to energy merchant activities is
presented separately from interest-rate hedging activities.
Total Cash-Flow Hedge Other Comprehensive Income Activity,
Net of Income Tax
Power Team
Normal Operations and
Hedging Activities
Interest-Rate and
Other Hedges(1)
Total Cash-
Flow Hedges
Accumulated OCI, January 1, 2002 $ 47 $ (2) $ 45
Changes in fair value (128) (3) (131)
Reclassifications from OCI to net income (33) – (33)
Accumulated OCI, December 31, 2002 (114) (5) (119)
Changes in fair value (186) (8) (194)
Reclassifications from OCI to net loss 167 – 167
Accumulated OCI derivative loss at December 31, 2003 $(133) $(13) $(146)
(1) Includes interest-rate hedges at Generation.
We use a Value-at-Risk (VaR) model to assess the market risk
associated with financial derivative instruments entered
into for proprietary trading purposes. The measured VaR
represents an estimate of the potential change in value of
our proprietary trading portfolio.
The VaR estimate includes a number of assumptions
about current market prices, estimates of volatility and
correlations between market factors. These estimates, how-
ever, are not necessarily indicative of actual results, which
may differ because actual market rate fluctuations may dif-
fer from forecasted fluctuations and because the portfolio
may change over the holding period.
We estimate VaR using a model based on the Monte
Carlo simulation of commodity prices that captures the
change in value of forward purchases and sales as well as
option values. Parameters and values are backtested daily
against daily changes in mark-to-market value for propri-
etary trading activity. Value-at-Risk assumes that normal
market conditions prevail and that there are no changes in
positions. We use a 95% confidence interval, one-day holding
period, one-tailed statistical measure in calculating our VaR.
This means that we may state that there is a one in 20
chance that, if prices move against our portfolio positions,
our pre-tax loss in liquidating our portfolio in a one-day
holding period would exceed the calculated VaR. To account
for unusual events and loss of liquidity, we use stress tests
and scenario analysis.
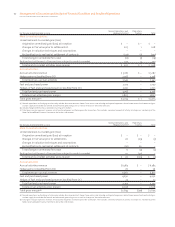
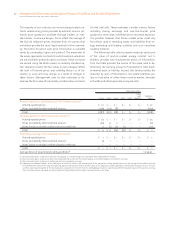
For financial reporting purposes only, we calculate sev-
eral other VaR estimates. The higher the confidence interval,
the less likely the chance that the VaR estimate would be
exceeded. A longer holding period considers the effect of
liquidity in being able to actually liquidate the portfolio. A
two-tailed test considers potential upside in the portfolio in
addition to the potential downside in the portfolio consid-
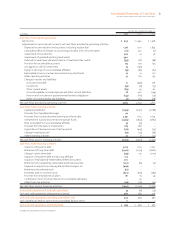
ered in the one-tailed test. The following table provides the
VaR for all proprietary trading positions of Generation as of
December 31, 2003.
Proprietary Trading VaR
2003
95% Confidence level, one-day holding period, one-tailed
Period end $ –
Average for the period (0.1)
High (0.2)
Low –
95% Confidence level, ten-day holding period, two-tailed
Period end $ (0.1)
Average for the period (0.5)
High (0.9)
Low (0.1)
99% Confidence level, one-day holding period, two-tailed
Period end $ –
Average for the period (0.2)
High (0.3)
Low –
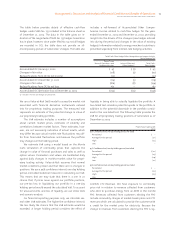
ComEd’s CTC Revenues. We have exposure to commodity
price risk in relation to revenue collected from customers
who elect to purchase energy from an ARES or the ComEd
PPO. Revenues collected from customers electing the PPO
include commodity charges at market-based prices and CTC
revenues which are calculated to provide the customer with
a credit for the market price for electricity. Because the
change in revenues from customers electing the PPO is sig-