ComEd 2003 Annual Report Download - page 76
Download and view the complete annual report
Please find page 76 of the 2003 ComEd annual report below. You can navigate through the pages in the report by either clicking on the pages listed below, or by using the keyword search tool below to find specific information within the annual report.-
 1
1 -
2
-
3
-
4
-
5
-
6
-
7
-
8
-
9
-
10
-
11
-
12
-
13
-
14
-
15
-
16
-
17
-
18
-
19
-
20
-
21
-
22
-
23
-
24
-
25
-
26
-
27
-
28
-
29
-
30
-
31
-
32
-
33
-
34
-
35
-
36
-
37
-
38
-
39
-
40
-
41
-
42
-
43
-
44
-
45
-
46
-
47
-
48
-
49
-
50
-
51
-
52
-
53
-
54
-
55
-
56
-
57
-
58
-
59
-
60
-
61
-
62
-
63
-
64
-
65
-
 66
66 -
 67
67 -
 68
68 -
 69
69 -
 70
70 -
 71
71 -
 72
72 -
 73
73 -
 74
74 -
 75
75 -
 76
76 -
 77
77 -
 78
78 -
 79
79 -
 80
80 -
 81
81 -
 82
82 -
 83
83 -
 84
84 -
 85
85 -
 86
86 -
87
-
88
-
89
-
90
-
91
-
92
-
93
-
94
-
95
-
96
-
97
-
98
-
99
-
100
-
101
-
102
-
103
-
104
-
105
-
106
-
107
-
108
-
109
-
110
-
111
-
112
-
113
-
114
-
115
-
116
-
117
-
118
-
119
-
120
-
121
-
122
-
123
-
124
-
125
-
126
-
127
-
128
-
129
-
130
-
131
-
132
-
133
-
134
-
135
-
136
-
137
-
138
 |
 |

74 Management’s Discussion and Analysis of Financial Condition and Results of Operations
EXELON CORPORATION AND SUBSIDIARY COMPANIES
nificantly offset by the change in CTC revenues, we do not
believe that our exposure to such a market price decrease
would be material.
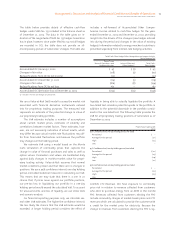
ComEd’s CTC revenues are also collected from customers
who elect to purchase energy from an ARES. ComEd’s CTC
rates are reset once a year in the spring, and customers can
elect to lock in their CTC rates for a one-, two- or three-year
term. Based on the current customers who have elected the
one-year CTC rates, we have performed a sensitivity analysis
to determine the net impact of a 10% increase in the average
market price of electricity which would result in a $14 million
decrease in CTC revenues. A 10% decrease in market prices
would result in a $14 million increase in CTC revenues. The
result may be significantly affected if additional customers
elect to purchase energy from an ARES or if customers elect
to purchase their energy from us.
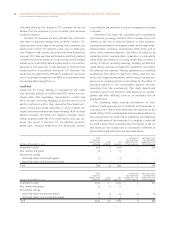
Credit Risk
Credit risk for Energy Delivery is managed by the credit
and collection policies of ComEd and PECO, which are con-
sistent with state regulatory requirements. ComEd and
PECO are each currently obligated to provide service to all
electric customers within their respective franchised terri-
tories. For the year ended December 31, 2003, ComEd’s ten
largest customers represented approximately 2% of its retail
electric revenues and PECO’s ten largest customers repre-
sented approximately 7% of its retail electric and gas rev-
enues. We record a provision for uncollectible accounts,
based upon historical experience and third-party studies,
to provide for the potential loss from nonpayment by these
customers.
Generation has credit risk associated with counterparty
performance on energy contracts which includes, but is not
limited to, the risk of financial default or slow payment.
Generation manages counterparty credit risk through estab-
lished policies, including counterparty credit limits, and in
some cases, requiring deposits and letters of credit to be
posted by certain counterparties. Generation’s counterparty
credit limits are based on a scoring model that considers a
variety of factors, including leverage, liquidity, profitability,
credit ratings and risk management capabilities. Generation
has entered into payment netting agreements or enabling
agreements that allow for payment netting with the ma-
jority of its large counterparties, which reduce Generation’s
exposure to counterparty risk by providing for the offset of
amounts payable to the counterparty against amounts
receivable from the counterparty.The credit department
monitors current and forward credit exposure to counter-
parties and their affiliates, both on an individual and an
aggregate basis.
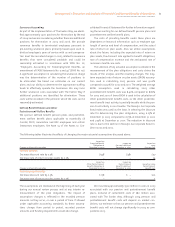
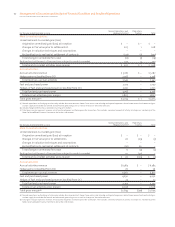
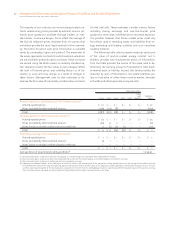
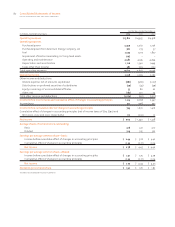
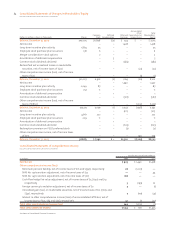
The following tables provide information on Gen-
eration’s credit exposure, net of collateral, as of December 31,
2003 and 2002. They further delineate that exposure by the
credit rating of the counterparties and provide guidance on
the concentration of credit risk to individual counterparties
and an indication of the maturity of a company’s credit risk
by credit rating of the counterparties. The figures in the ta-
bles below do not include sales to Generation’s affiliates or
exposure through ISOs which are discussed below.
Rating as of December 31, 2003
Total
Exposure
Before Credit
Collateral
Credit
Collateral
Net
Exposure
Number Of
Counterparties
Greater than 10%
of Net Exposure
Net Exposure Of
Counterparties
Greater than 10%
of Net Exposure
Investment grade $116 $– $116 1 $20
Non-investment grade 22 7 15 – –
No external ratings
Internally rated–investment grade 13 – 13 – –
Internally rated–non-investment grade 1 – 1 – –
Total $152 $7 $145 1 $20
Rating as of December 31, 2002
Total
Exposure
Before Credit
Collateral
Credit
Collateral
Net
Exposure
Number Of
Counterparties
Greater th an 10%
of Net Exposure
Net Exposure Of
Counterparties
Greater than 10%
of Net Exposure
Investment grade $ 156 $ – $156 2 $ 71
Non-investment grade 17 11 6 – –
No external ratings
Internally rated–investment grade 27 4 23 4 16
Internally rated–non-investment grade 4 2 2 – –
Total $204 $17 $187 6 $87