ComEd 2003 Annual Report Download - page 51
Download and view the complete annual report
Please find page 51 of the 2003 ComEd annual report below. You can navigate through the pages in the report by either clicking on the pages listed below, or by using the keyword search tool below to find specific information within the annual report.-
 1
1 -
2
-
3
-
4
-
5
-
6
-
7
-
8
-
9
-
10
-
11
-
12
-
13
-
14
-
15
-
16
-
17
-
18
-
19
-
20
-
21
-
22
-
23
-
24
-
25
-
26
-
27
-
28
-
29
-
30
-
31
-
32
-
33
-
34
-
35
-
36
-
37
-
38
-
39
-
40
-
 41
41 -
 42
42 -
 43
43 -
 44
44 -
 45
45 -
 46
46 -
 47
47 -
 48
48 -
 49
49 -
 50
50 -
 51
51 -
 52
52 -
 53
53 -
 54
54 -
 55
55 -
 56
56 -
 57
57 -
 58
58 -
 59
59 -
 60
60 -
 61
61 -
62
-
63
-
64
-
65
-
66
-
67
-
68
-
69
-
70
-
71
-
72
-
73
-
74
-
75
-
76
-
77
-
78
-
79
-
80
-
81
-
82
-
83
-
84
-
85
-
86
-
87
-
88
-
89
-
90
-
91
-
92
-
93
-
94
-
95
-
96
-
97
-
98
-
99
-
100
-
101
-
102
-
103
-
104
-
105
-
106
-
107
-
108
-
109
-
110
-
111
-
112
-
113
-
114
-
115
-
116
-
117
-
118
-
119
-
120
-
121
-
122
-
123
-
124
-
125
-
126
-
127
-
128
-
129
-
130
-
131
-
132
-
133
-
134
-
135
-
136
-
137
-
138
 |
 |

49Management’s Discussion and Analysis of Financial Condition and Results of Operations
EXELON CORPORATION AND SUBSIDIARY COMPANIES
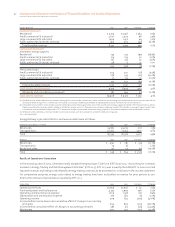
Results of Operations by Business Segment
The comparisons of 2002 and 2001 operating results and other statistical information set forth below reflect intercompany
transactions, which are eliminated in our consolidated financial statements.
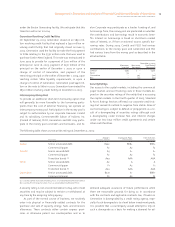
Income (Loss) Before Cumulative Effect of Changes in Accounting Principles by Business Segment
2002 2001 Variance % Change
Energy Delivery $1,268 $1,022 $246 24.1%
Generation 387 512 (125) (24.4%)
Enterprises 65 (85) 150 176.5%
Corporate (50) (33) (17) (51.5%)
Total $1,670 $ 1,416 $ 254 17.9%
Net Income (Loss) by Business Segment
2002 2001 Variance % Change
Energy Delivery $1,268 $1,022 $246 24.1%
Generation 400 524 (124) (23.7%)
Enterprises (178) (85) (93) (109.4%)
Corporate (50) (33) (17) (51.5%)
Total $1,440 $1,428 $ 12 0.8%
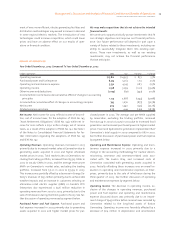
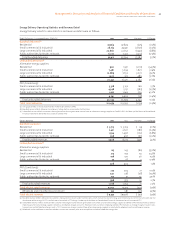
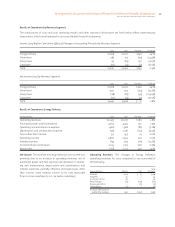
Results of Operations–Energy Delivery
Energy Delivery 2002 2001 Variance % Change
Operating revenues $10,457 $10,171 $286 2.8%
Purchased power and fuel expense 4,602 4,472 130 2.9%
Operating and maintenance expense 1,486 1,568 (82) (5.2%)
Depreciation and amortization expense 978 1,081 (103) (9.5%)
Taxes other than income 531 457 74 16.2%
Operating income 2,860 2,593 267 10.3%
Interest expense 854 973 (119) (12.2%)
Income before income taxes 2,033 1,725 308 17.9%
Net income 1,268 1,022 246 24.1%
Net Income. The increase in Energy Delivery’s net income was
primarily due to an increase in operating revenues net of
purchased power and fuel expense and decreases in operat-
ing and maintenance, depreciation and amortization and
interest expenses, partially offset by increased taxes other
than income, lower interest income on its note receivable
from Unicom Investments, Inc., an Exelon subsidiary.
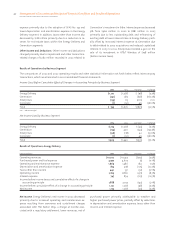
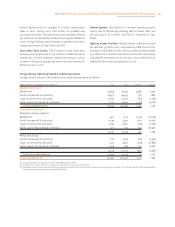
Operating Revenues. The changes in Energy Delivery’s
operating revenues for 2002 compared to 2001 consisted of
the following:
Energy Delivery Electric Gas
Total
Variance
Volume $224 $ 15 $ 239
Weather 151 2 153
Customer choice 95 – 95
Rate changes (54) (108) (162)
Resales and other – (15) (15)
Other effects (25) 1 (24)
Increase (decrease) in
operating revenues $391 $(105) $286