ComEd 2003 Annual Report Download - page 50
Download and view the complete annual report
Please find page 50 of the 2003 ComEd annual report below. You can navigate through the pages in the report by either clicking on the pages listed below, or by using the keyword search tool below to find specific information within the annual report.-
 1
1 -
2
-
3
-
4
-
5
-
6
-
7
-
8
-
9
-
10
-
11
-
12
-
13
-
14
-
15
-
16
-
17
-
18
-
19
-
20
-
21
-
22
-
23
-
24
-
25
-
26
-
27
-
28
-
29
-
30
-
31
-
32
-
33
-
34
-
35
-
36
-
37
-
38
-
39
-
 40
40 -
 41
41 -
 42
42 -
 43
43 -
 44
44 -
 45
45 -
 46
46 -
 47
47 -
 48
48 -
 49
49 -
 50
50 -
 51
51 -
 52
52 -
 53
53 -
 54
54 -
 55
55 -
 56
56 -
 57
57 -
 58
58 -
 59
59 -
 60
60 -
61
-
62
-
63
-
64
-
65
-
66
-
67
-
68
-
69
-
70
-
71
-
72
-
73
-
74
-
75
-
76
-
77
-
78
-
79
-
80
-
81
-
82
-
83
-
84
-
85
-
86
-
87
-
88
-
89
-
90
-
91
-
92
-
93
-
94
-
95
-
96
-
97
-
98
-
99
-
100
-
101
-
102
-
103
-
104
-
105
-
106
-
107
-
108
-
109
-
110
-
111
-
112
-
113
-
114
-
115
-
116
-
117
-
118
-
119
-
120
-
121
-
122
-
123
-
124
-
125
-
126
-
127
-
128
-
129
-
130
-
131
-
132
-
133
-
134
-
135
-
136
-
137
-
138
 |
 |

48 Management’s Discussion and Analysis of Financial Condition and Results of Operations
EXELON CORPORATION AND SUBSIDIARY COMPANIES
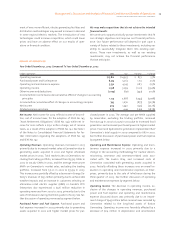
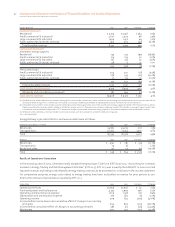
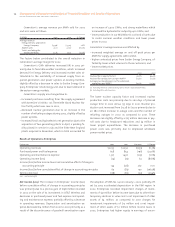
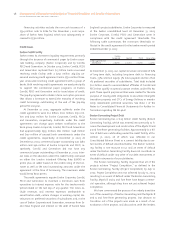
Year Ended December 31, 2002 Compared To Year Ended December 31, 2001
Exelon Corporation 2002 2001 Variance % Change
Operating revenues $14,955 $14,918 $ 37 0.2%
Purchased power and fuel expense 5,262 5,090 172 3.4%
Operating and maintenance expense 4,345 4,394 (49) (1.1%)
Operating income 3,299 3,362 (63) (1.9%)
Other income and deductions (631) (1,015) 384 (37.8%)
Income before income taxes and cumulative effect of changes in accounting
principles 2,668 2,347 321 13.7%
Income before cumulative effect of changes in accounting principles 1,670 1,416 254 17.9%
Net income 1,440 1,428 12 0.8%
Diluted earnings per share 4.44 4.43 0.01 0.2%
Net Income. Net income for 2002 reflects a $230 million
after-tax charge for the cumulative effect of changes in ac-
counting principles as a result of the adoption of SFAS No.
142, while net income for 2001 reflects $12 million of after-tax
income for the cumulative effect of changes in accounting
principles as a result of the adoption of SFAS No. 133,
“Accounting for Derivatives and Hedging Activities” (SFAS
No. 133). See Note 1 of the Notes to Consolidated Financial
Statements for further information regarding the adoptions
of SFAS No. 142 and SFAS No. 133.
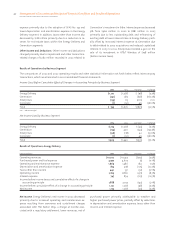
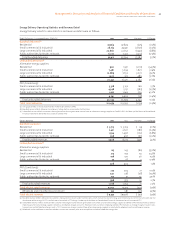
Operating Revenues. Operating revenues were comparable
from 2001 to 2002. Energy Delivery experienced an increase
of $286 million primarily due to increases in weather
normalized volumes and positive weather impacts which
was partially offset by a $259 million decrease at Enterprises
primarily due to the discontinuance of retail sales in the PJM
region at Exelon Energy Company and lower construction
revenues at Exelon Services. See further discussion of operat-
ing revenues by segment below.
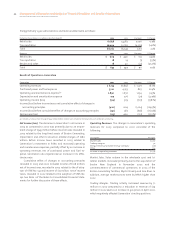
Purchased Power and Fuel Expense.Purchased power and
fuel expense increased in 2002 compared to 2001 primarily
due to an increase in purchased power associated with in-
creased power supplied by Generation. Total GWhs supplied
by Generation, exclusive of trading activity, was 207,540
GWhs in 2002 compared to 196,126 GWhs in 2001. The aver-
age supply cost per MWh supplied by Generation was con-
sistent from 2001 to 2002. See further discussion of pur-
chased power and fuel expense by segment below.
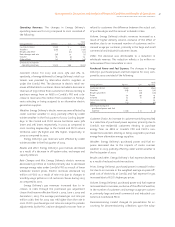
Operating and Maintenance Expense. Operating and main-
tenance expense was consistent from 2001 to 2002. An in-
crease in operating and maintenance expense at Generation
of $128 million primarily due to increased refueling outages
and generating asset acquisitions in April and November
2002 was partially offset by reduced operating maintenance
expenses at Energy Delivery and Enterprises. See further dis-
cussion of operating and maintenance expenses by segment
below.
Operating Income. Operating income decreased in 2002 as
compared to 2001 primarily due to the increase in purchased
power and fuel expense discussed above, partially offset by a
decrease in depreciation and amortization expense primarily
due to the cessation of goodwill amortization.
Other Income and Deductions. Other income and deductions
changed primarily due a gain on the sale of Enterprises’ in-
vestment in AT&T Wireless of $198 million recorded in 2002,
an increase in income on Generation’s nuclear decom-
missioning trust funds and a reduction in interest expense
at Energy Delivery due to less debt outstanding and the re-
financing of existing debt at lower rates.